22 Things Economic Developers Need to Know This Week
The stories Dane thinks you need to see. February 12, 2026 edition.

Welcome to this week's issue of What Economic Developers Need to Know This Week, where we collect links, charts, and ideas about the economy and place.
This week: 22 stories, graphics, and rabbit holes that are mostly relevant to economic development, and occasionally just funny.
If you are wondering what to do with the info in this newsletter: forward one item to a board member or elected official. It makes you look prepared.

Today's email is brought to you by Resource Development Group
Founded in 1995, RDG offers customized economic development fundraising solutions exclusively for Chambers of Commerce and Economic Development Organizations. That’s their niche. That’s their specialty.
Their highly experienced team has raised over $2 billion -- yes, that’s $2 billion with a “B” -- for communities of all sizes and organizations just like yours.
Every community is unique. Tulsa, OK, is not Maury County, TN. Atlanta, GA is not Detroit, MI. Chattanooga, TN is not Charlottesville, VA. Don’t use another community’s fundraising playbook and expect the same results!
RDG's experts excel in providing customized economic development fundraising solutions for every situation. So whether you’re a single county EDO ready to kick off your first fundraising campaign or a large regional organization on your third funding cycle, they have the team and experience to get you the results you’re looking for.
1) Econ dev news roundup: This week’s edition tracks updates from 63 executives and organizations across 32 states, which makes it a fast way to spot leadership moves and local momentum. Read it here: Economic development and developers in the news #230.

2) Rural economic development in 2026: Episode 208 with Lisa Hurley gets concrete about logistics, childcare capacity, housing pressure, workforce shortages, and local resistance to change in York County, Nebraska. Listen here: Podcast 208.

3) The hiring market for economic developers: This week’s board shows 39 openings across 19 states, with posted pay from $40,140 to $197,963, a useful benchmark for staffing competition. Browse: 39 new economic development jobs this week.
4) Catch-up links: If you missed recent editions, use these as backfill reading. See 30 things economic developers need to know this week (Feb 5) and economic development and developers in the news #229.
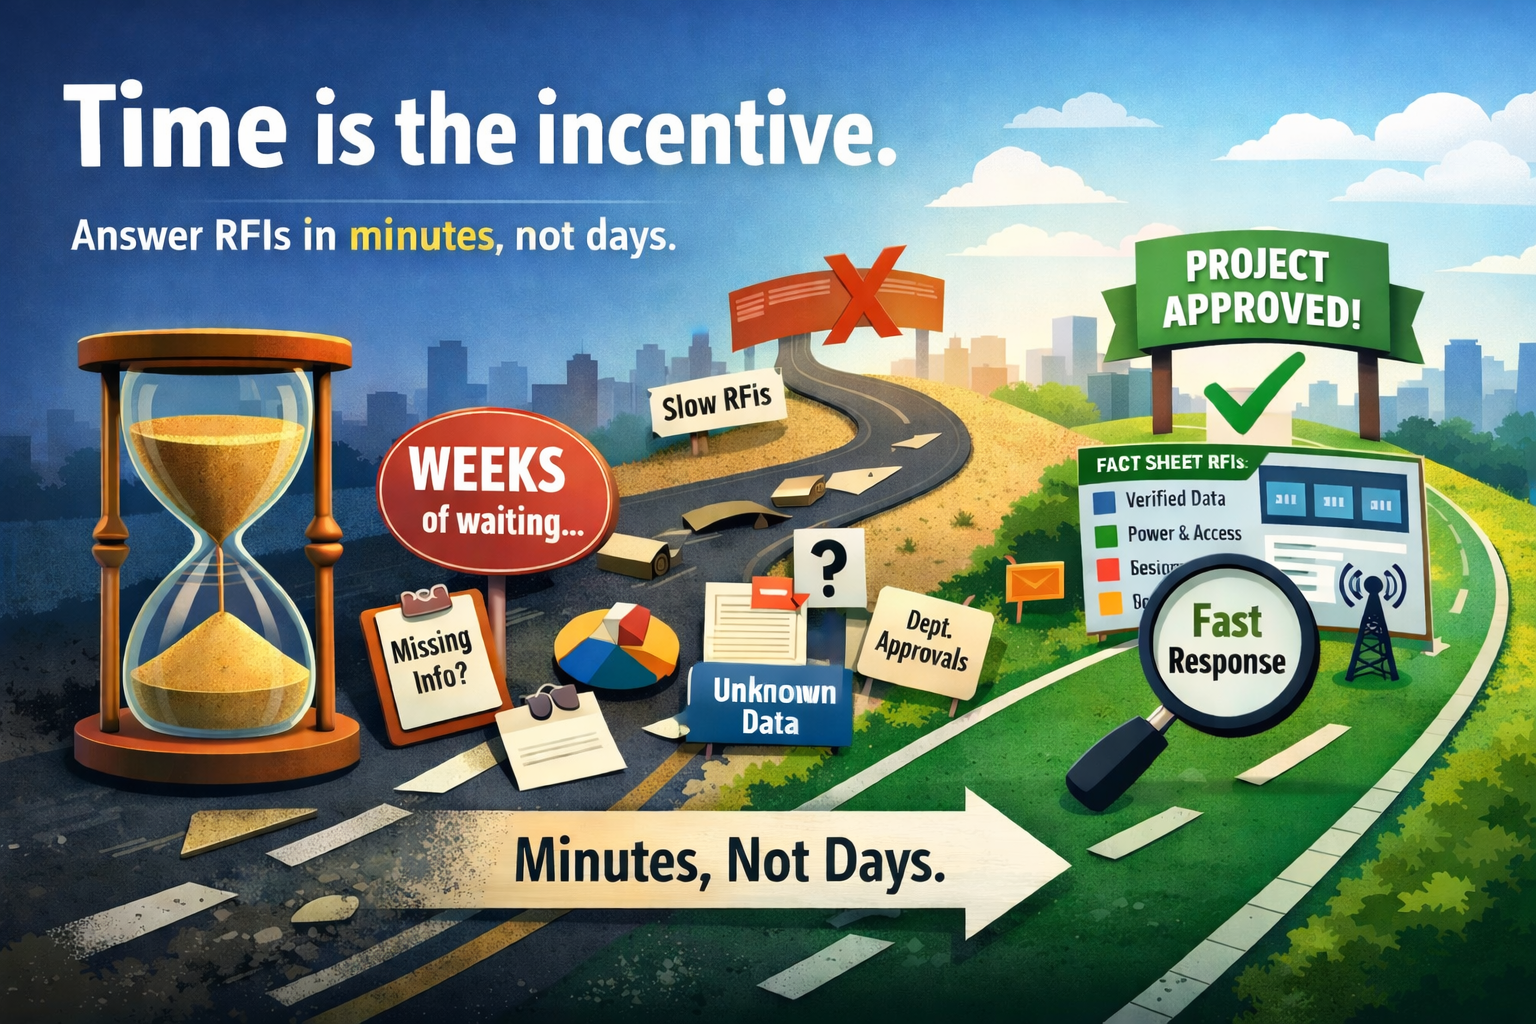
5) Time is the incentive: The core argument is that project momentum dies during the first RFI, especially on power, broadband, zoning viability, access, and what is verified vs estimated vs unknown. Read: Time is the incentive.
Land, housing, and behavior
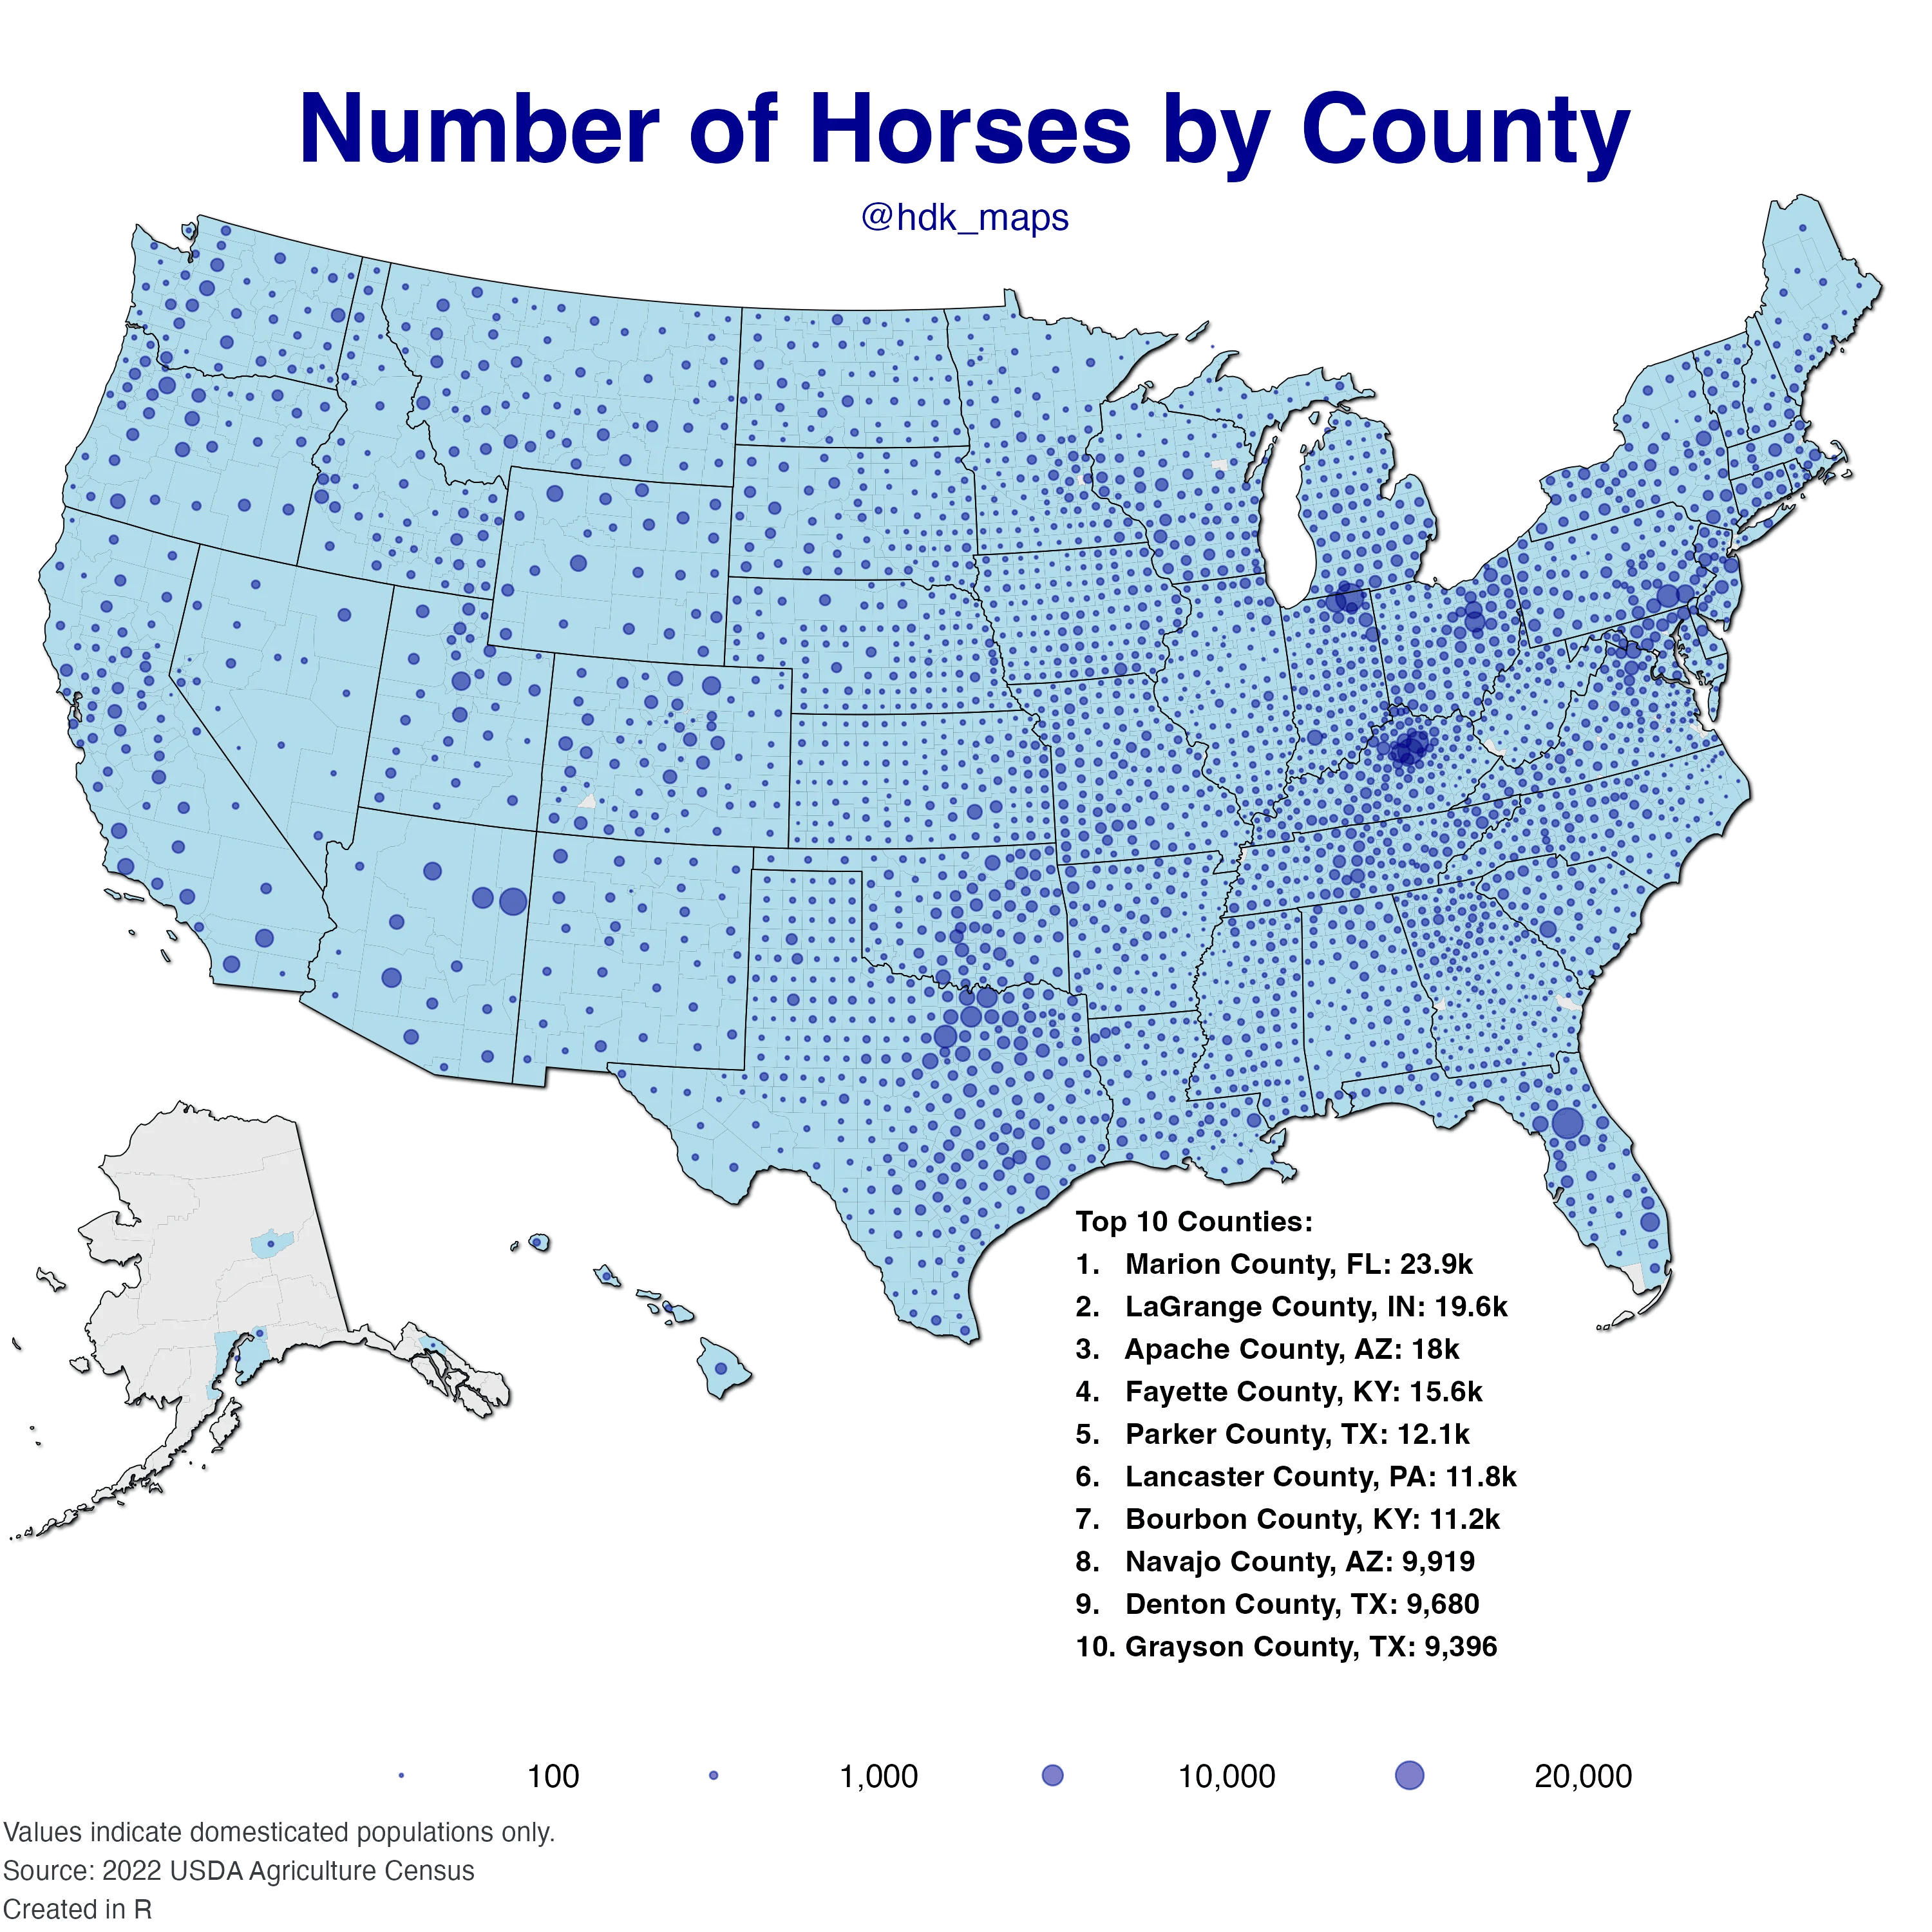
6) Horses as a land-use signal: This county map is a useful proxy for exurban/rural land use and amenity patterns, with notable concentrations in Marion County, FL and LaGrange County, IN.
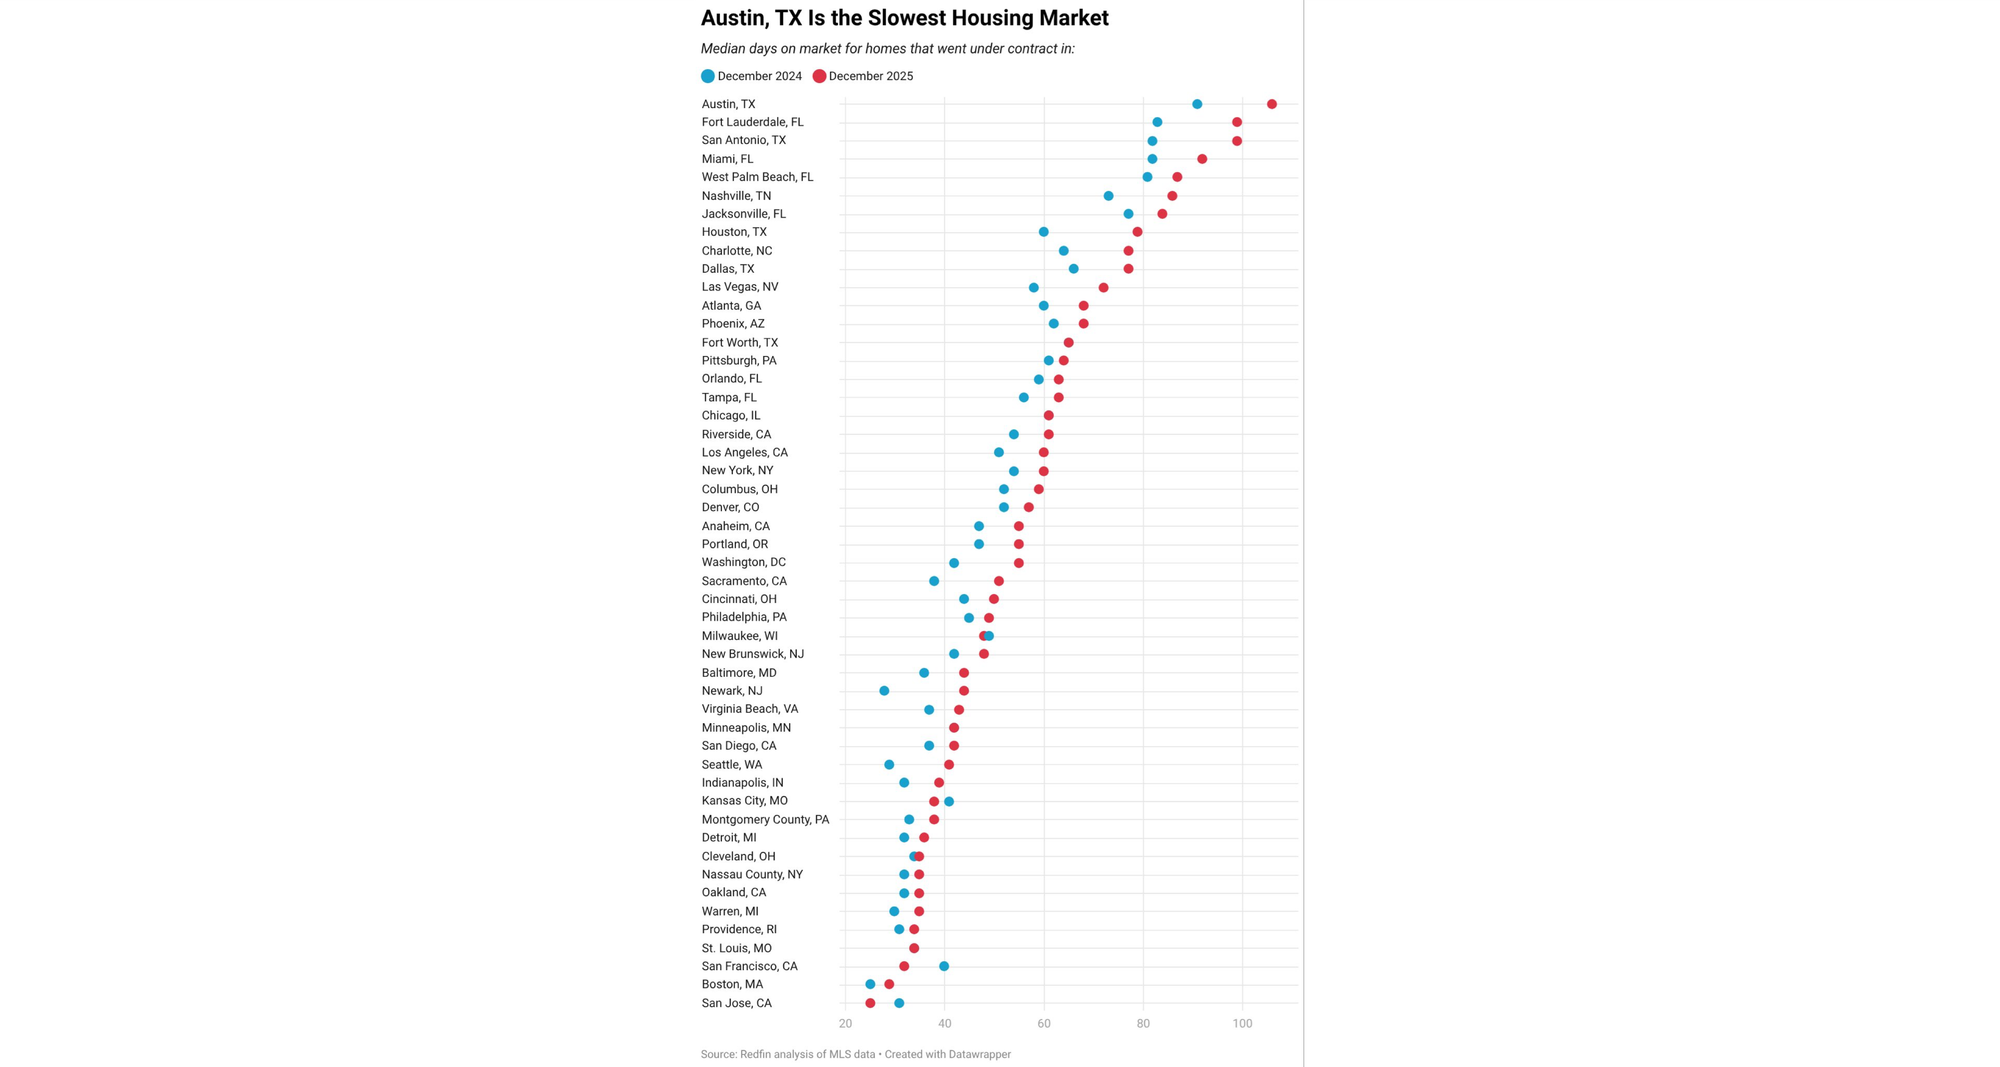
7) Housing market speed by metro: The Redfin chart shows Austin among the slowest large markets by median days on market, while several Northeast/Midwest metros are materially faster.
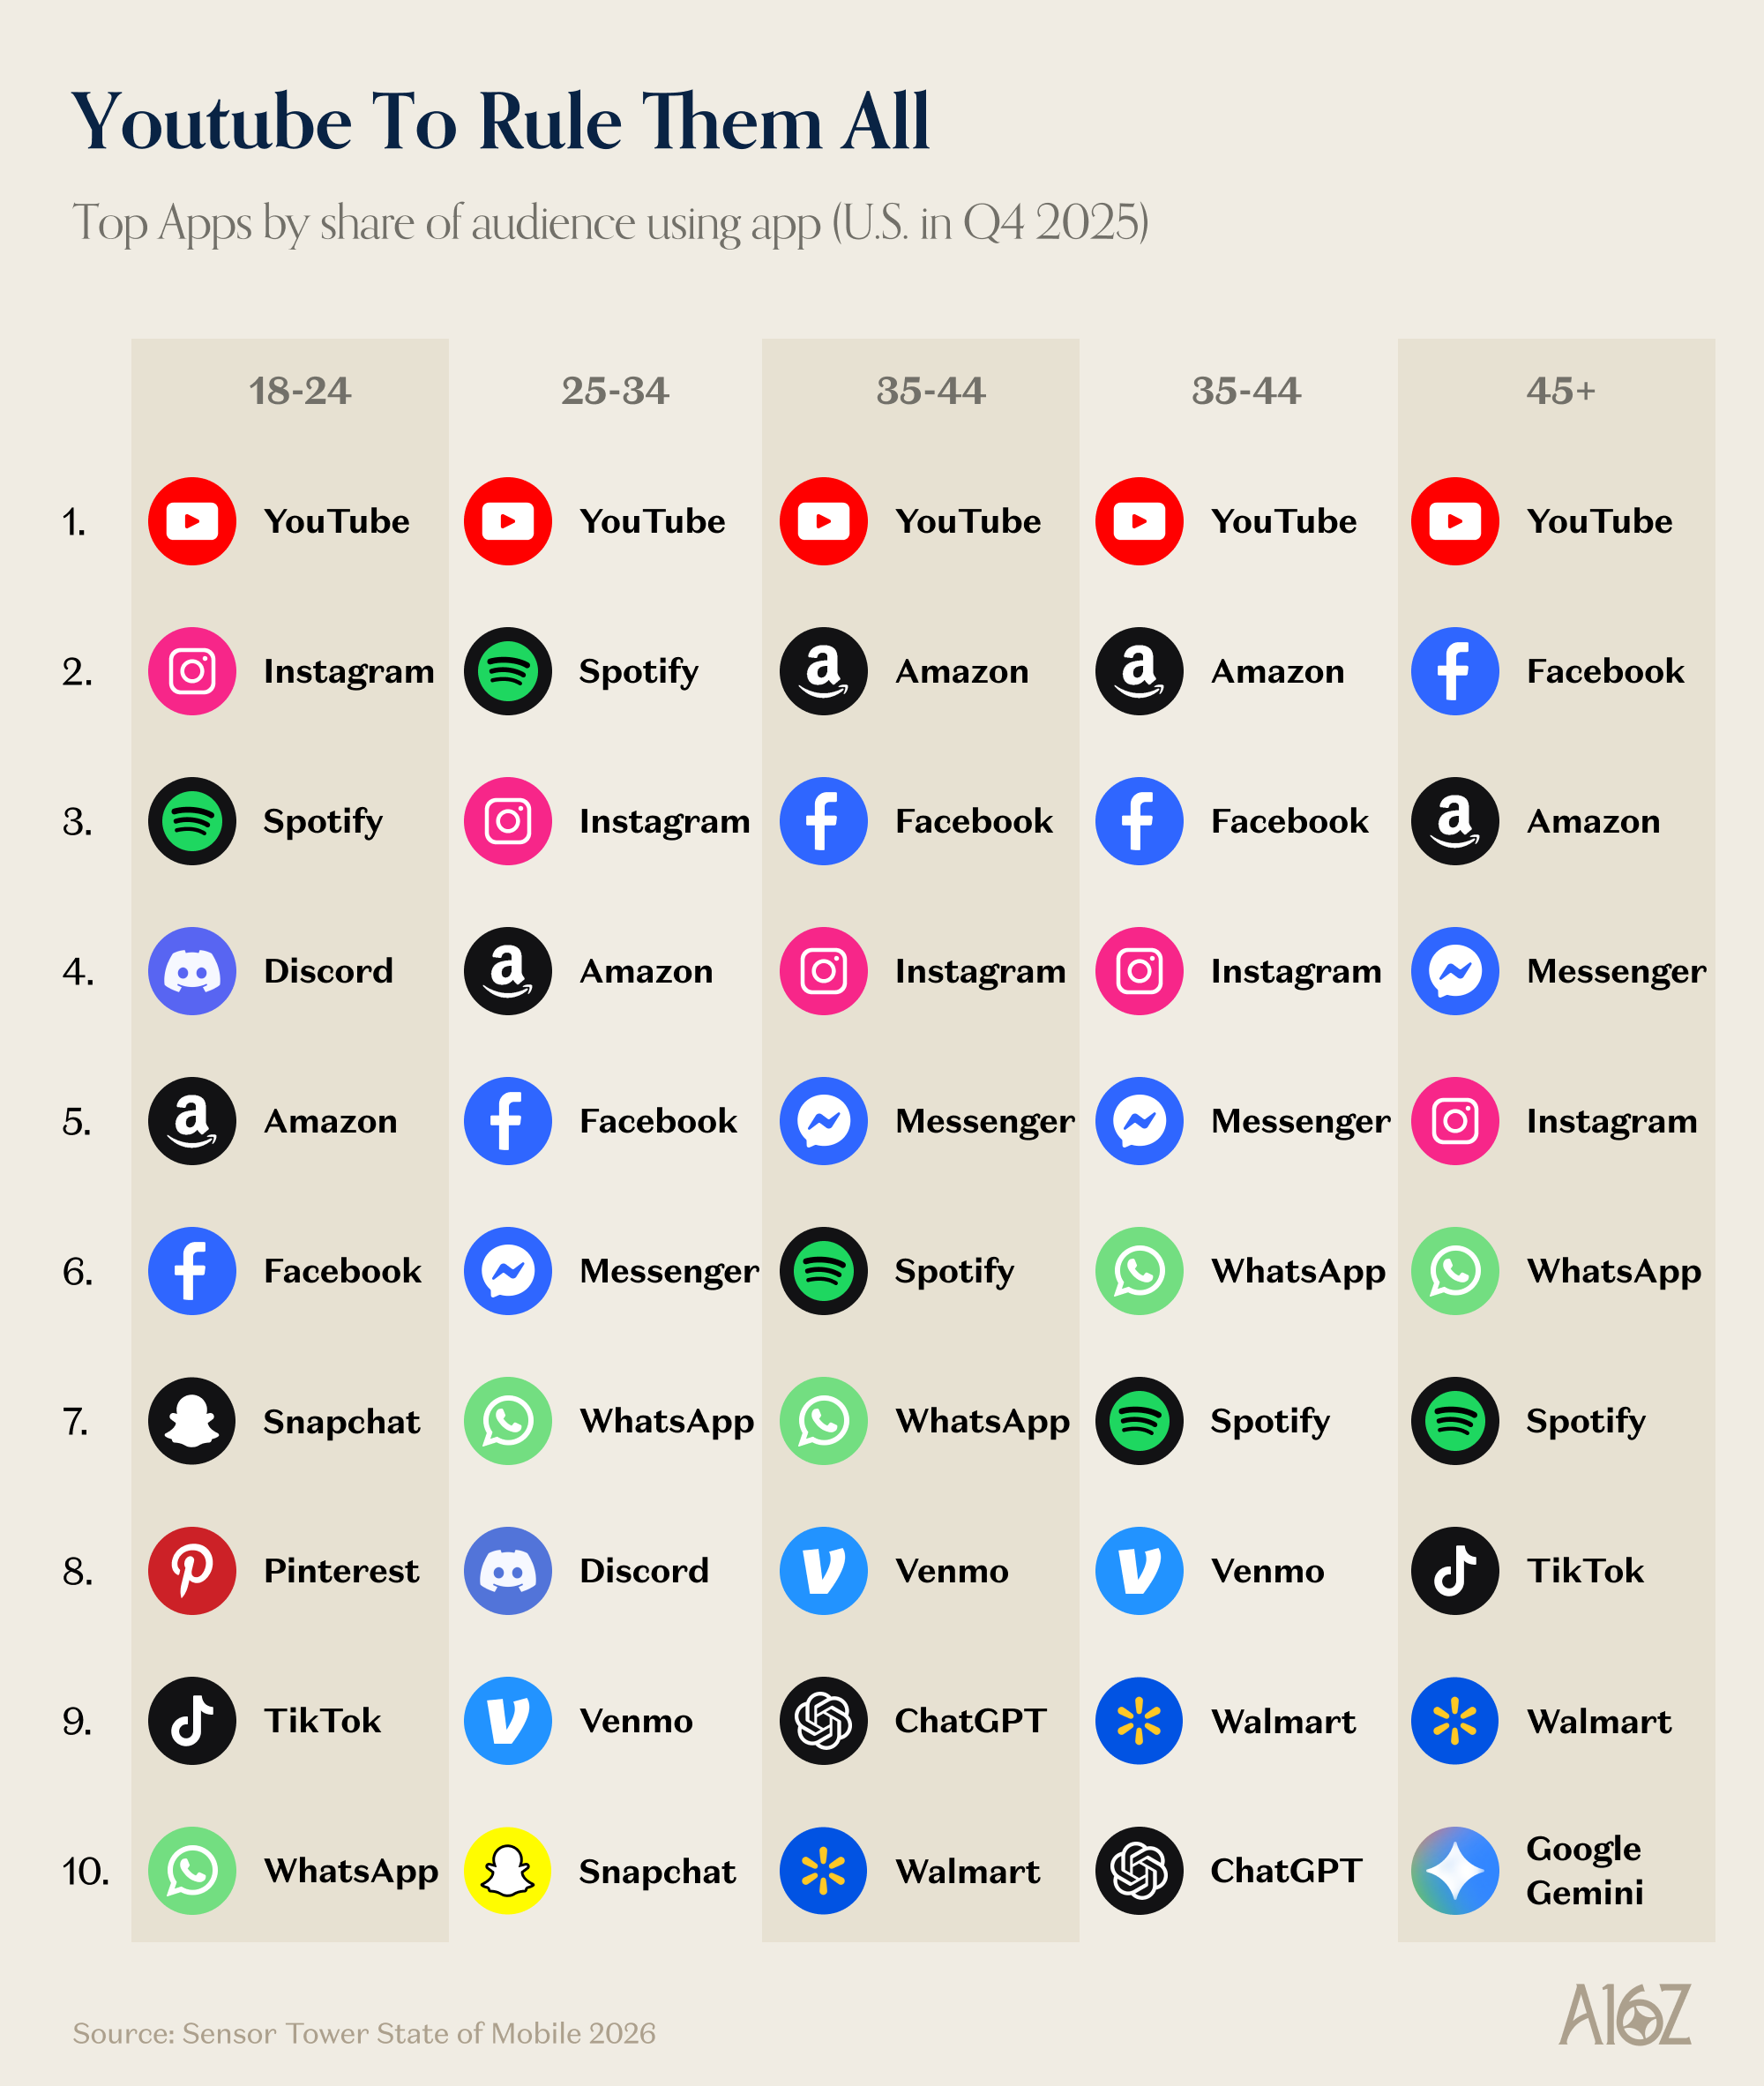
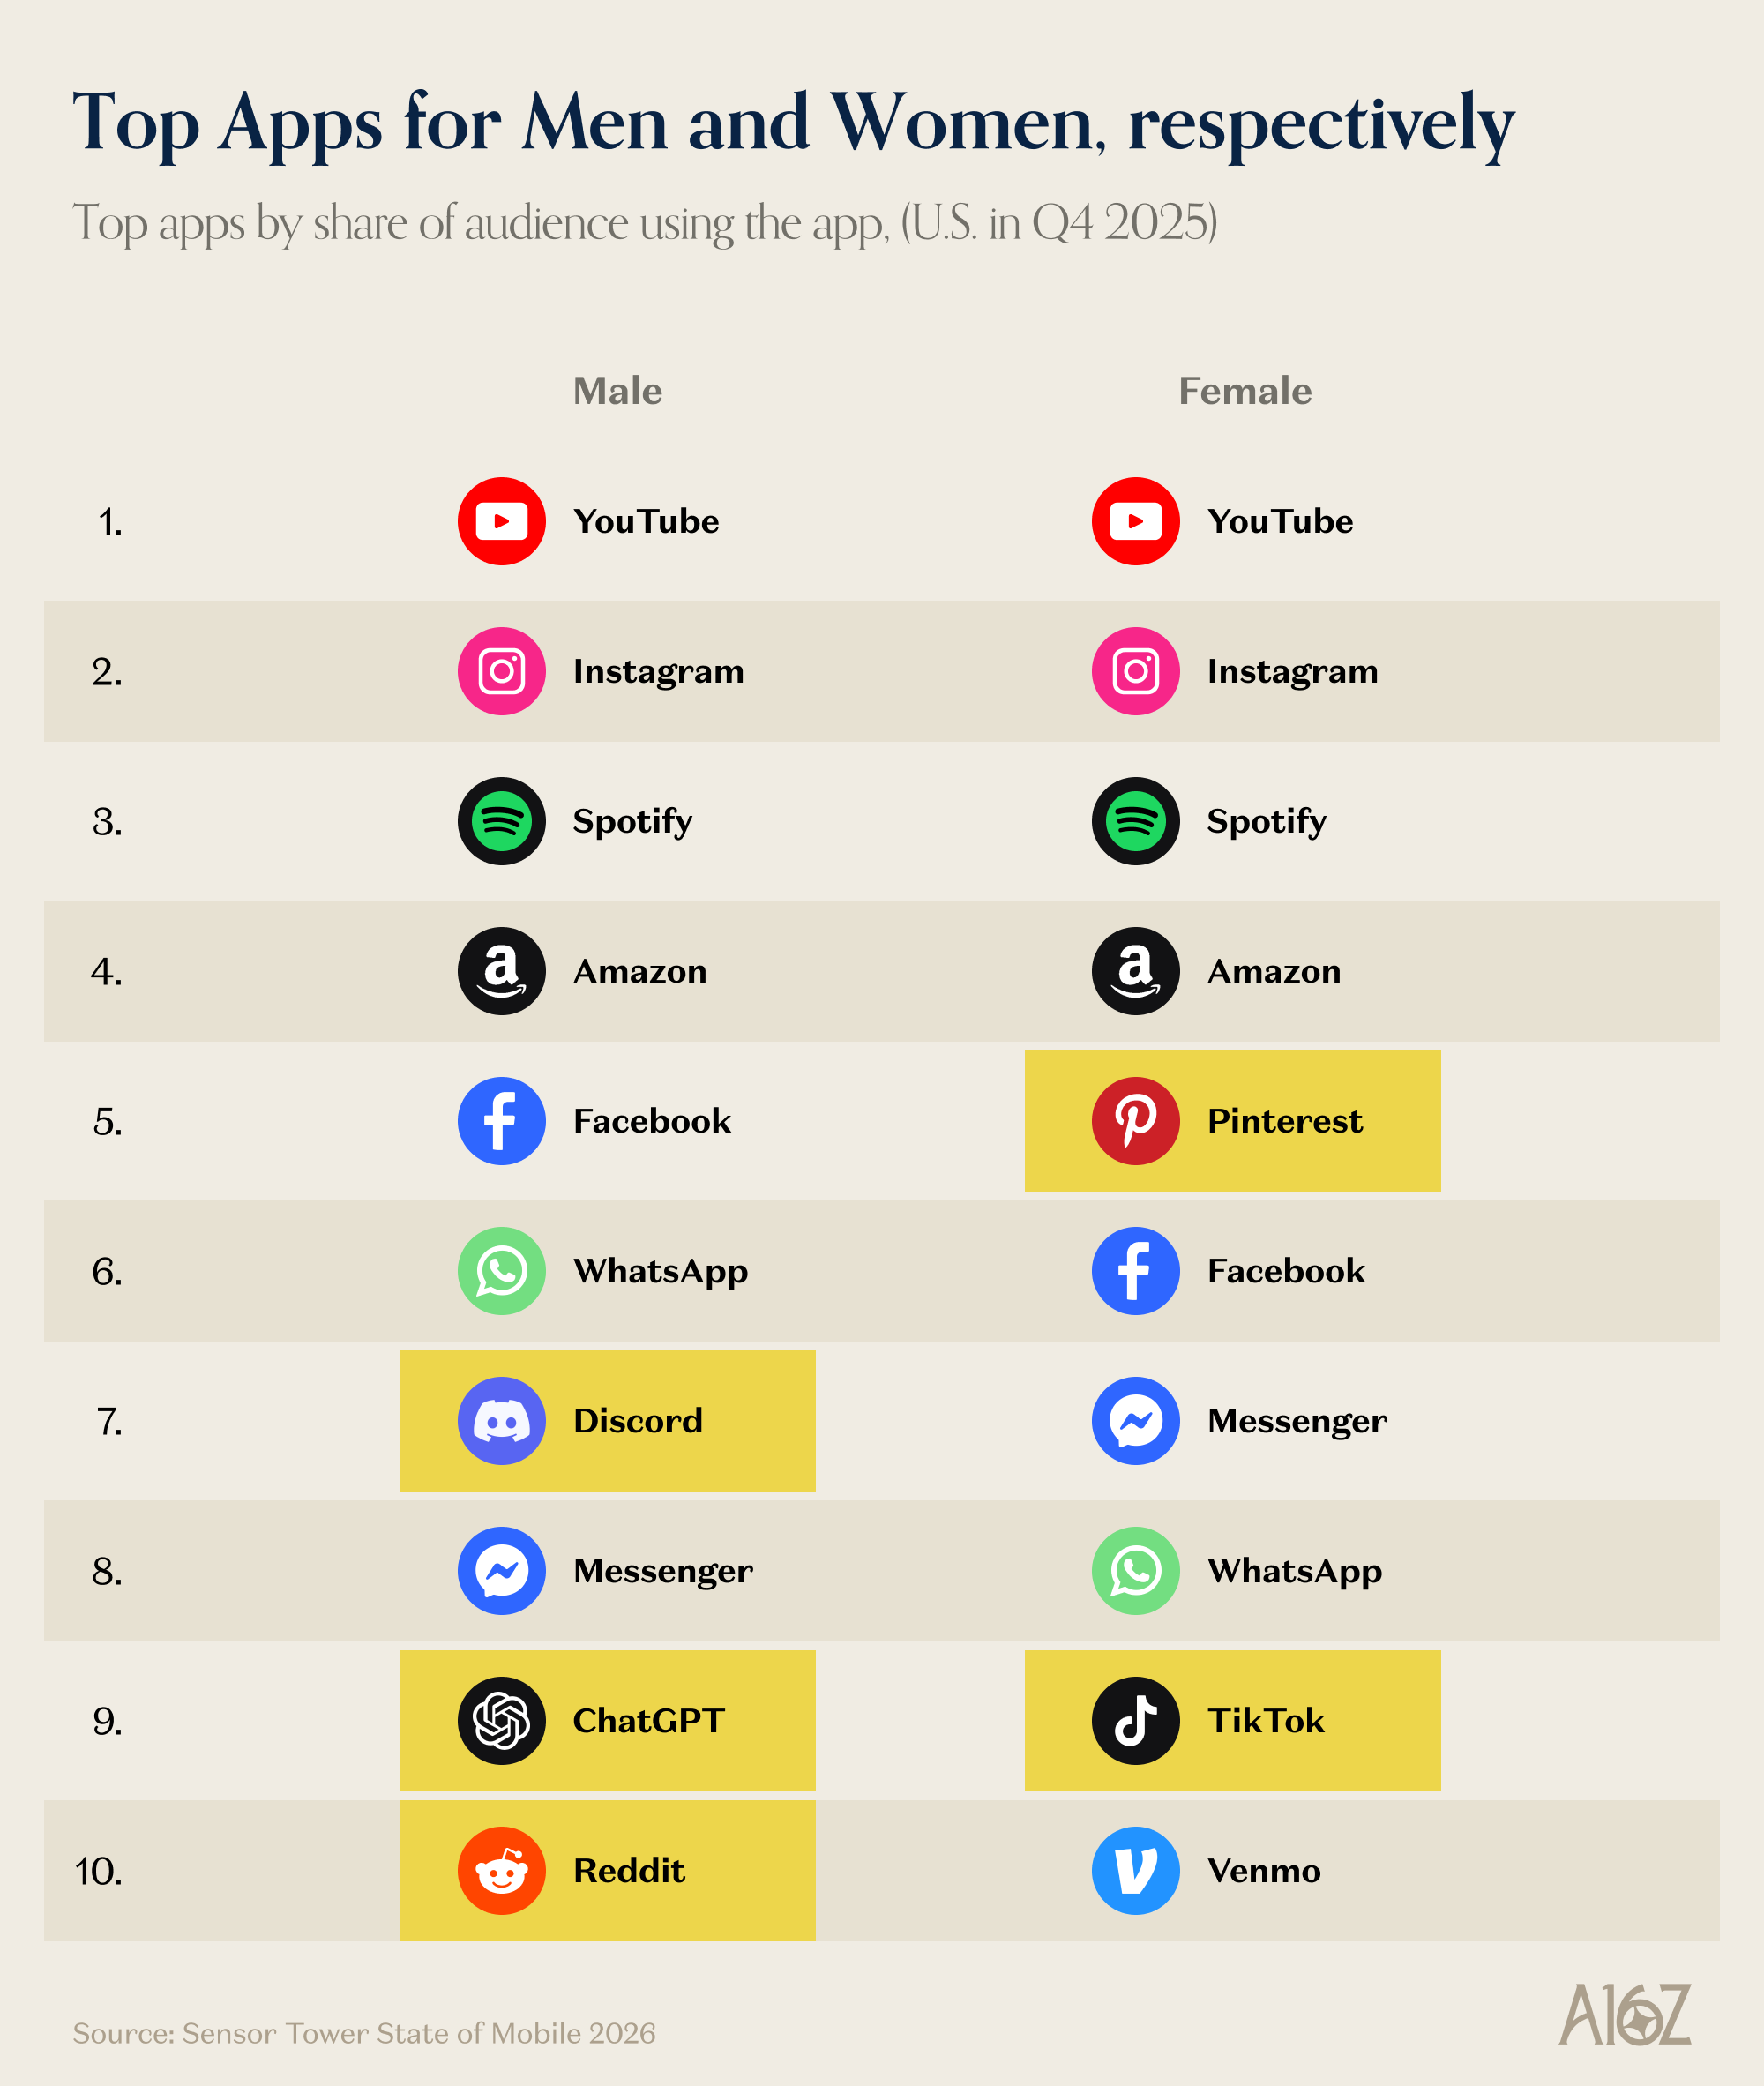
8) Mobile attention stack, all in one: a16z’s mobile roundup plus these charts show YouTube’s cross-age dominance and useful gender/app differences for channel strategy. Read: Best of the best of mobile.
9) Prediction markets and betting crossover: Axios reports the rise of Polymarket and Kalshi as part of a broader U.S. gambling surge, with implications for consumer behavior and regulation. Read: Prediction markets fuel gambling surge in U.S..
10) Opportunity Zones 2.0 planning window: This Novogradac brief flags that OZ 2.0 nominations begin in 2026, with an emphasis on state and local preparation now. Read: OZ 2.0 nominations start in 2026.
11) Downtown and small-town execution: These two pieces both argue identity and practical local habits matter more than cosmetic programming. Read Your downtown doesn't have a programming problem and Is my small town the only one that is this messed up?.
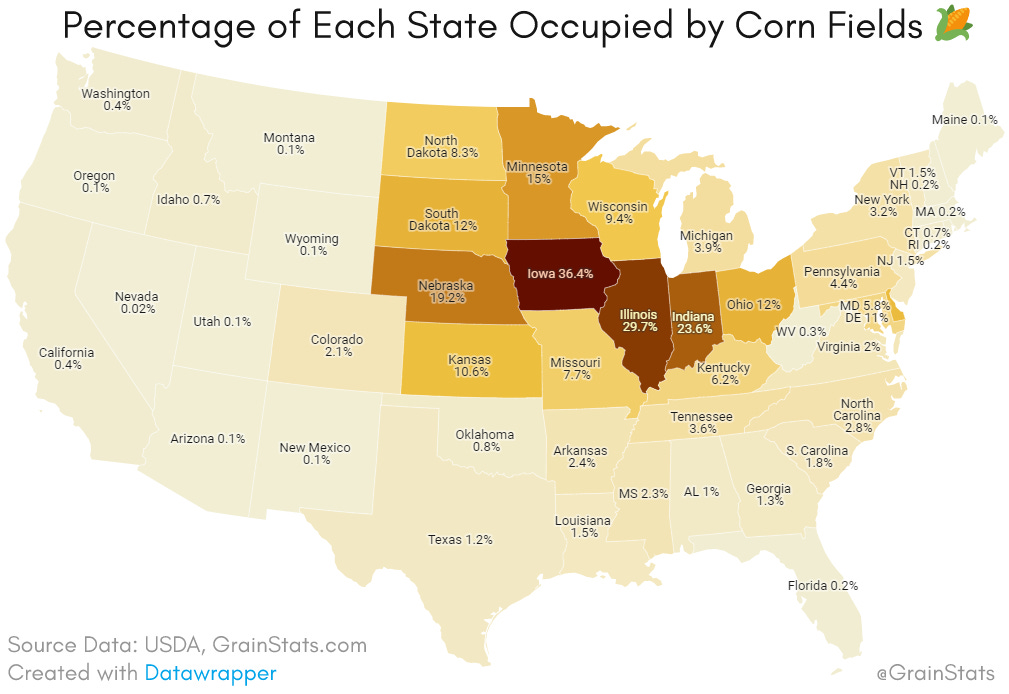
12) State land-use pattern snapshot: This map of corn-field share by state is a quick visual on agricultural concentration and regional land-intensity differences. See the source post: X post.
Infrastructure and sites
13) Data center boom, local upside: Brookings argues communities need deliberate value-capture strategies so large data center deals convert into durable local prosperity. Read: Turning the data center boom into long-term local prosperity.
14) Site selection perspectives, startup to consultant: Pair this founder-focused episode with the 2026 consultant survey to see where decision criteria overlap and where they diverge. Listen to The unicorn's guide to site selection and read Go where you're happy.
15) Rural vs non-metro definitions: John Shepard walks through why “rural” and “non-metro” are not interchangeable terms, which matters for program eligibility and policy design. Read: Is rural really the same as non-metro?.
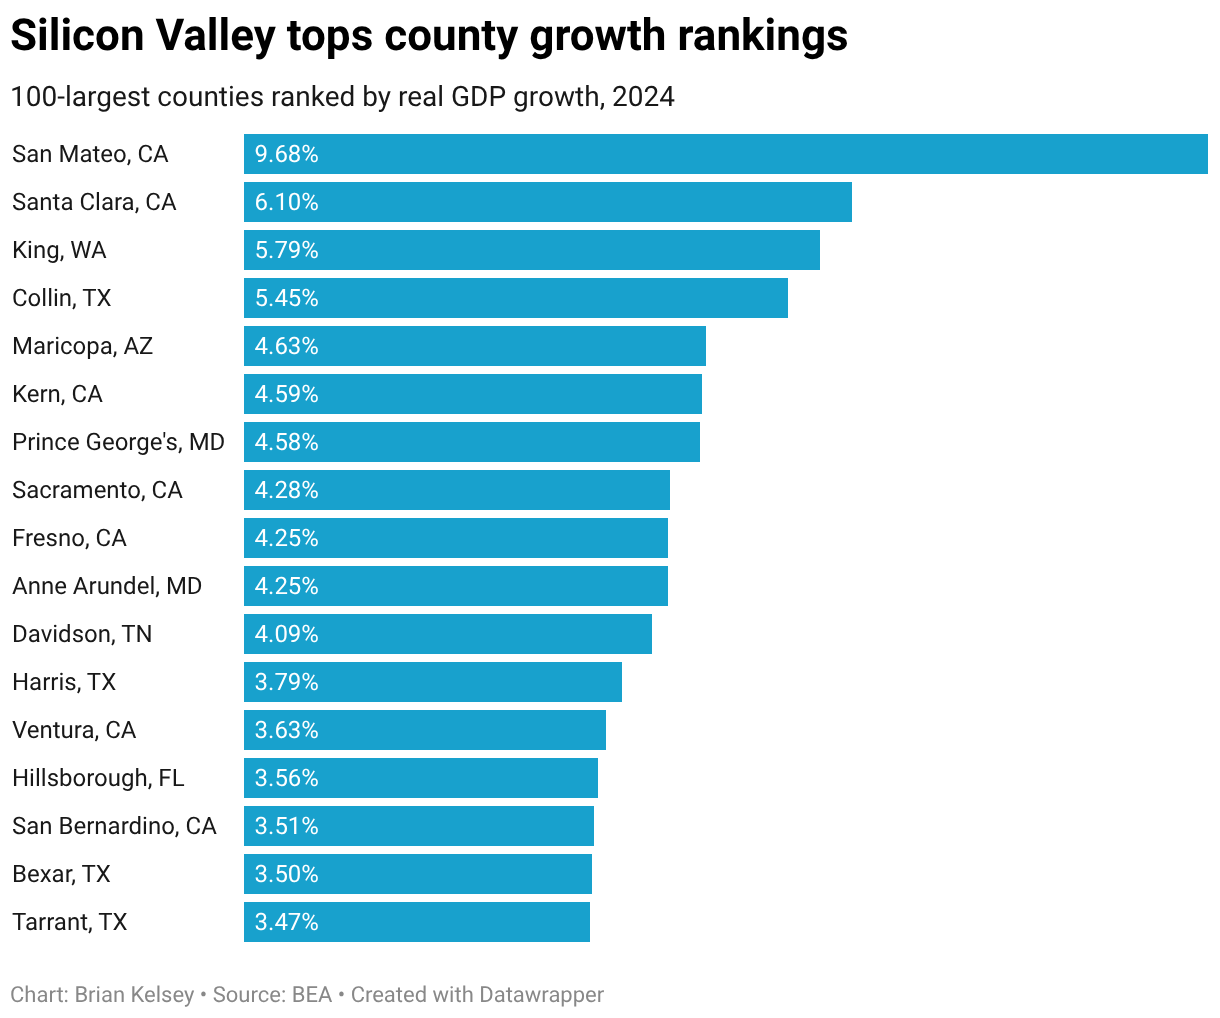
16) County growth leaderboard: New BEA county GDP data in this analysis puts San Mateo and Santa Clara at the top for 2024 real growth among the 100 largest counties. Read: Silicon Valley tops county growth rankings.
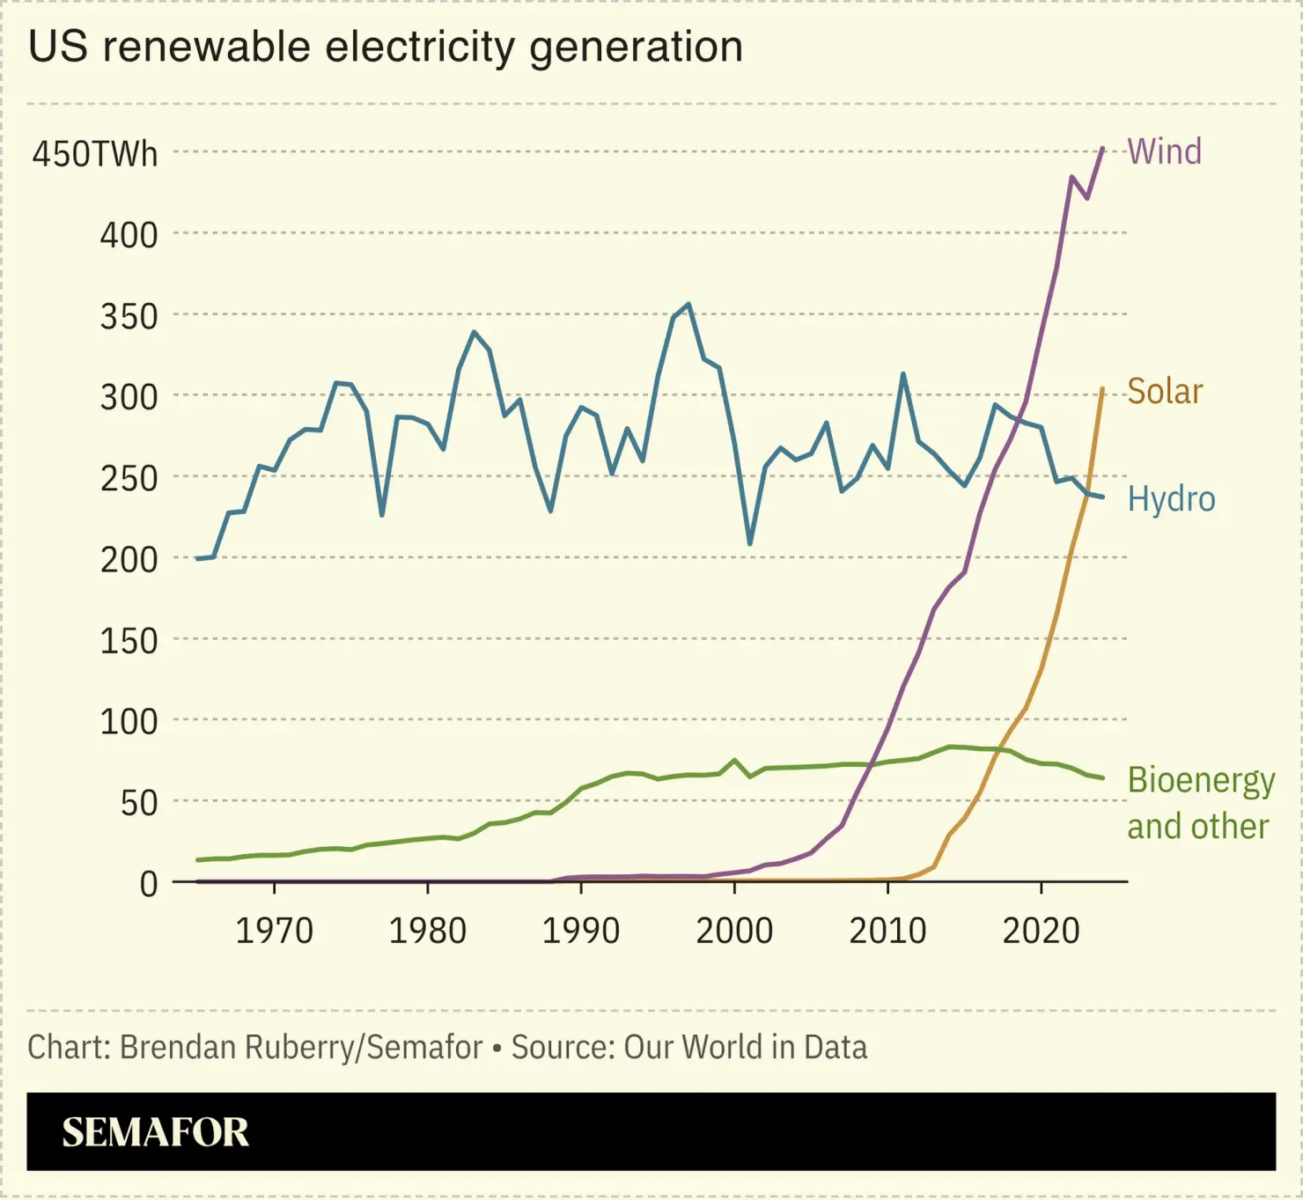
17) U.S. renewable generation shift: The long-run chart shows wind near 450 TWh and solar near 300 TWh by 2024, while hydro remains relatively flat, shifting assumptions for power-intensive recruitment.
Economy and sentiment
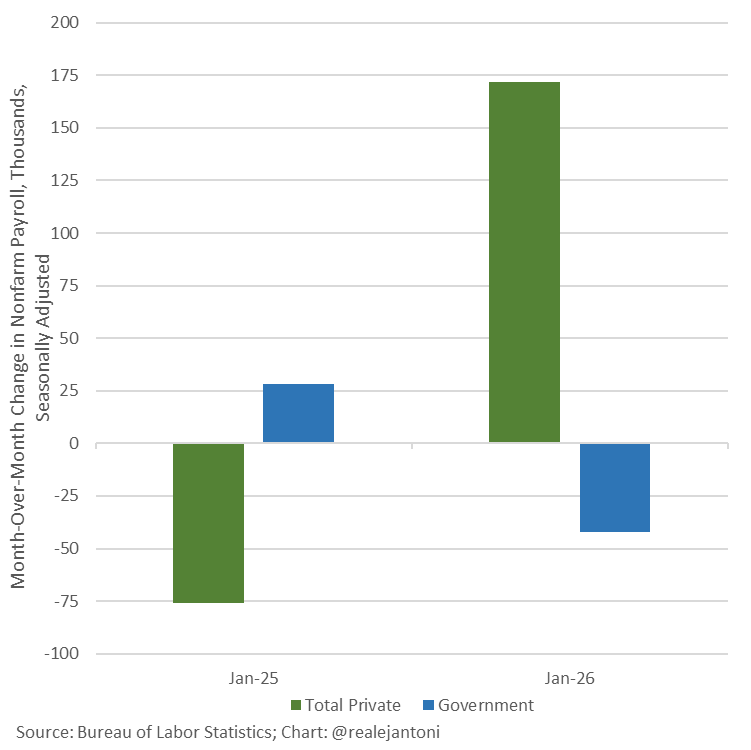
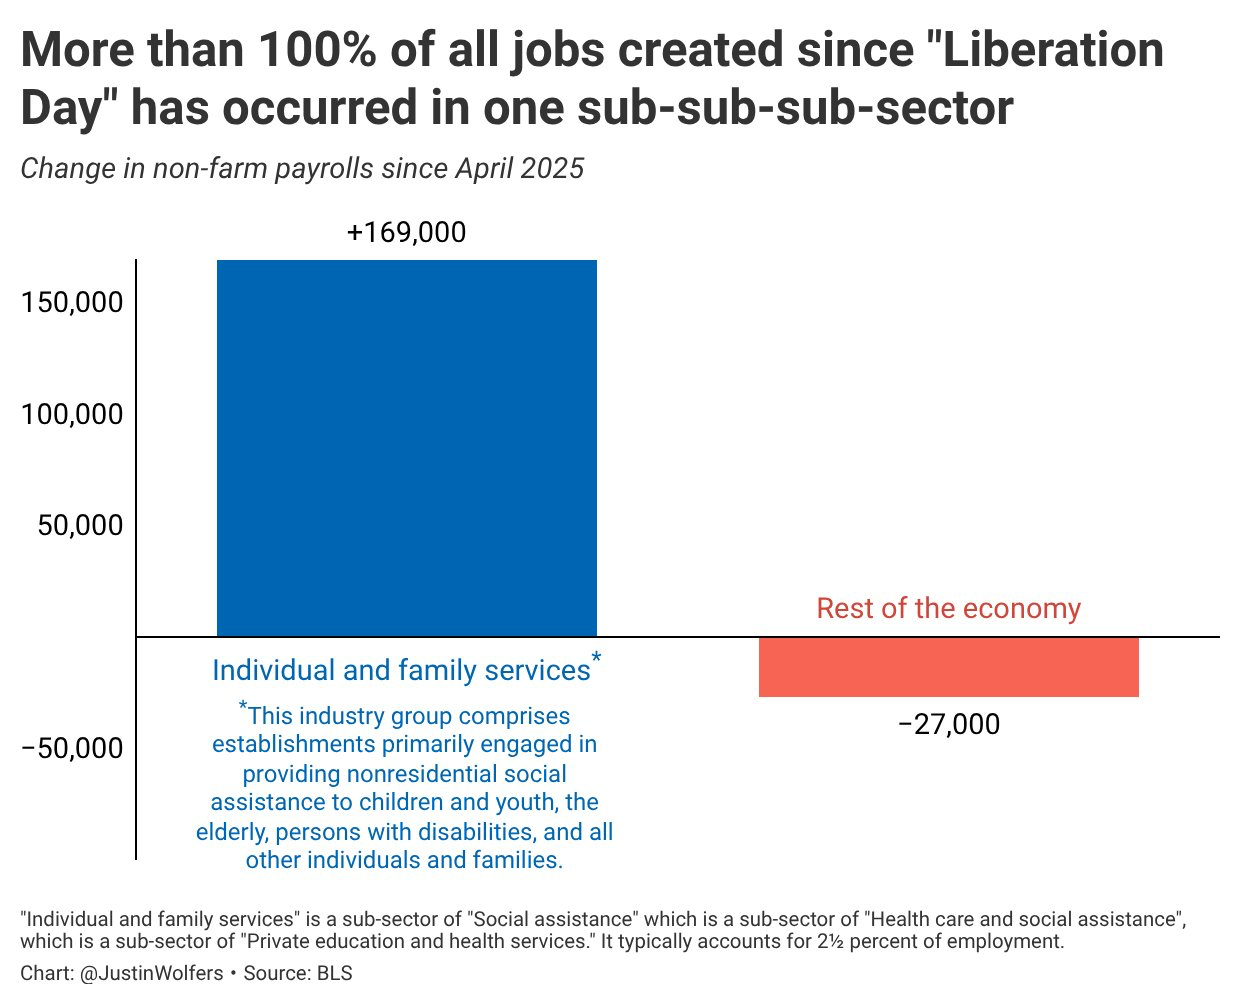
18) Labor composition warning set: Together these two charts show a narrow jobs engine and a private-vs-government swing, so headline payroll growth needs deeper reading.
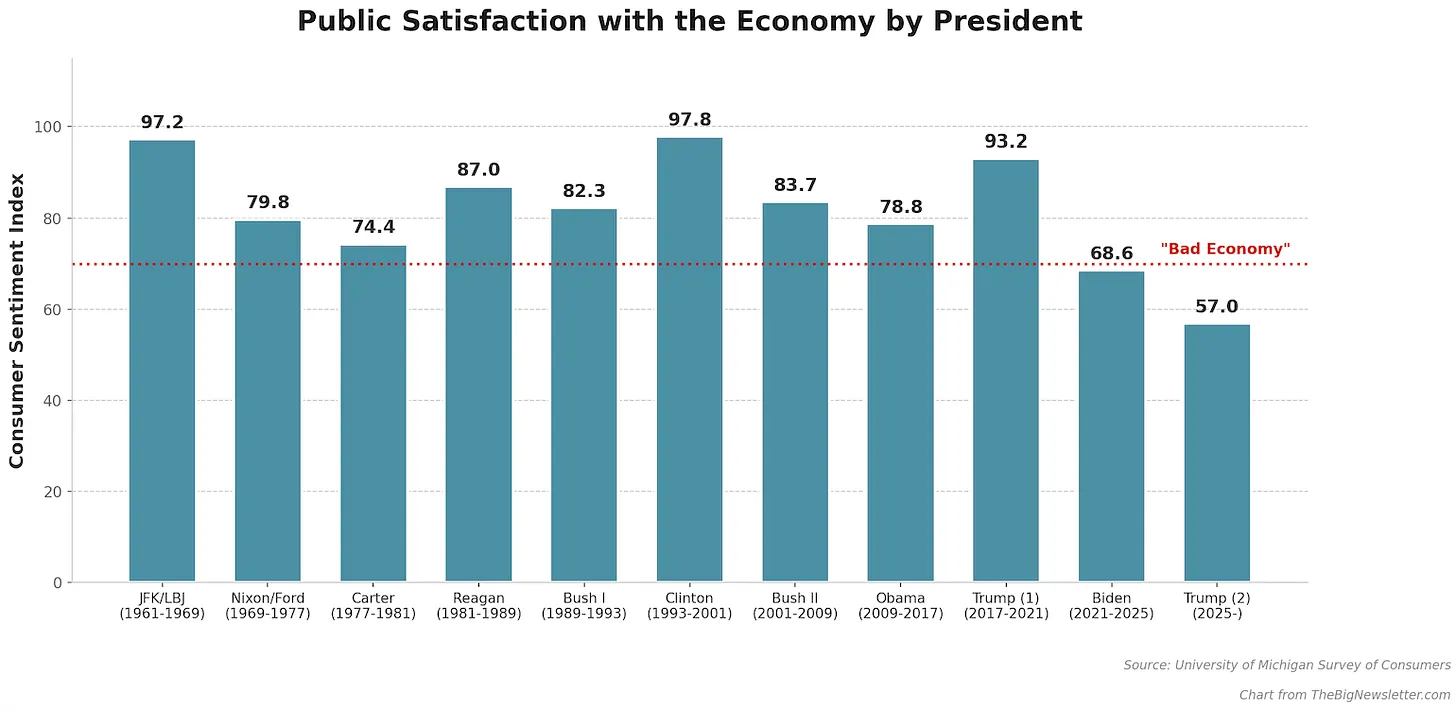
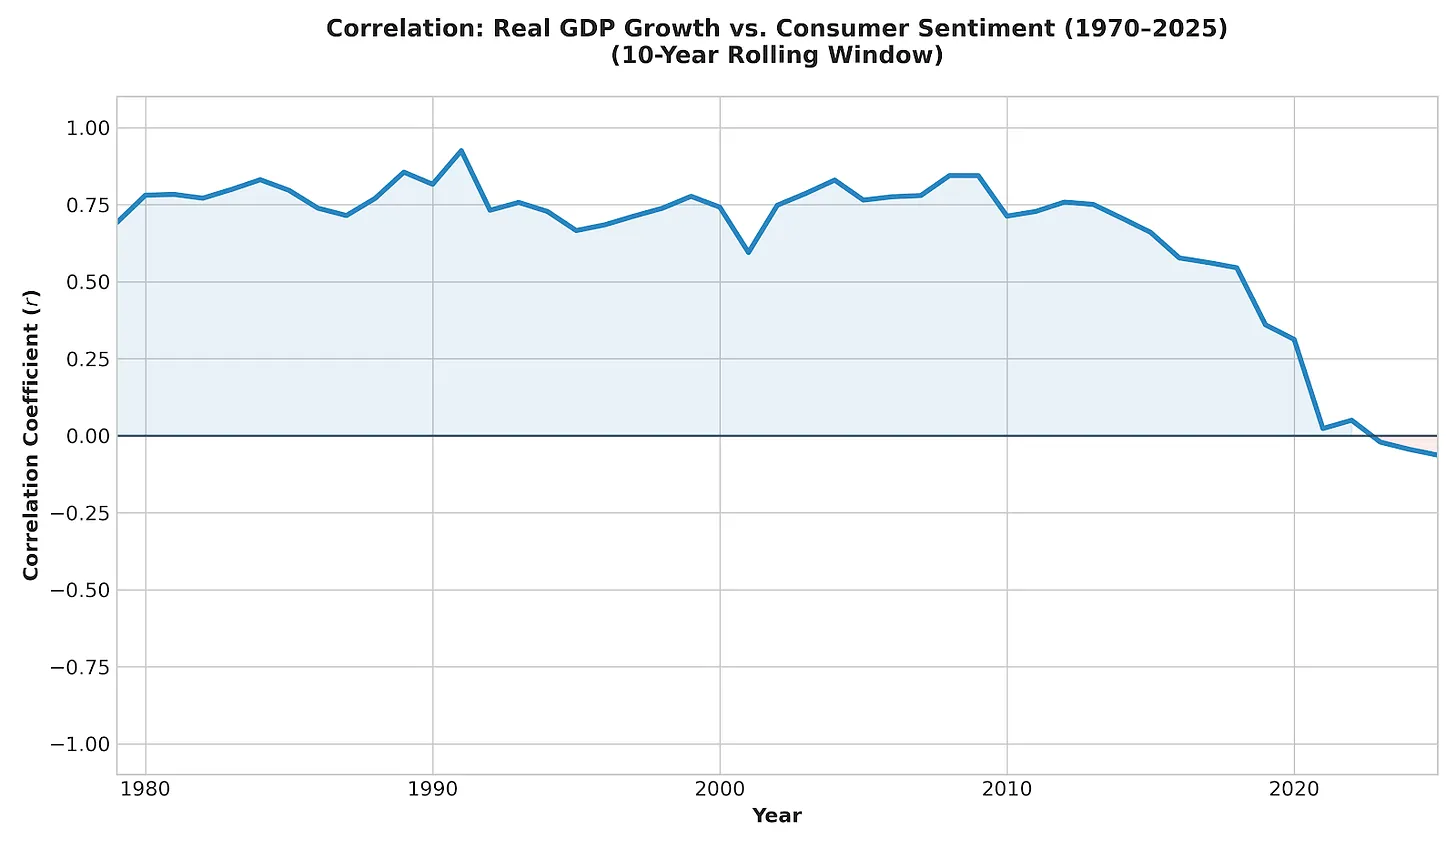
19) Boomcession set, article + two charts: The core idea is that aggregate economic strength and lived sentiment can diverge sharply. Read: The boomcession, then compare these two visuals.
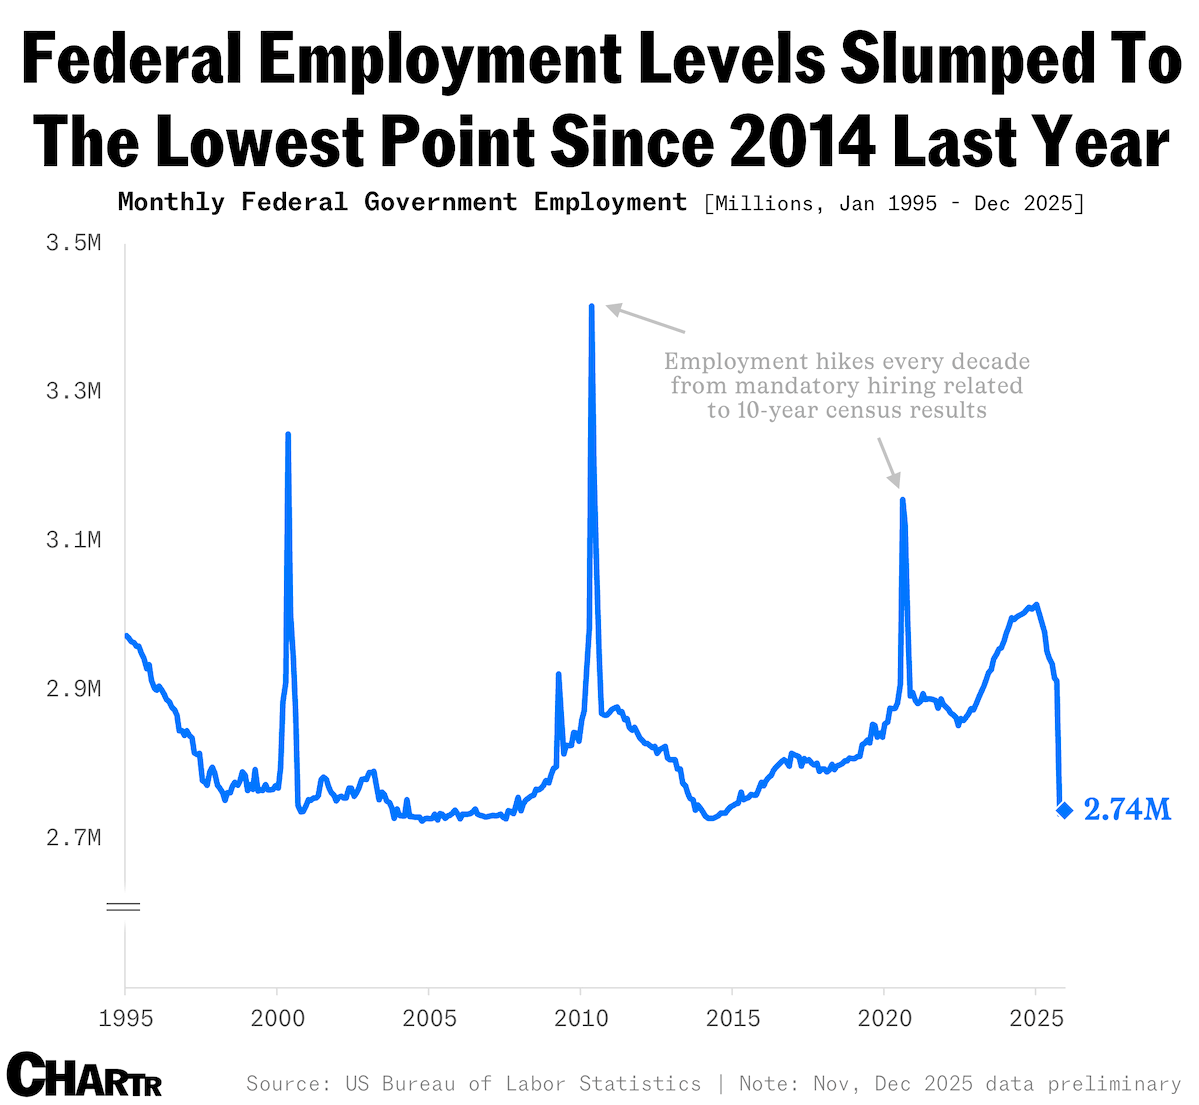
20) Federal workforce baseline: Federal civilian employment sits around 2.74 million in this chart, near the lowest level in over a decade, relevant for metro labor-pool analysis.
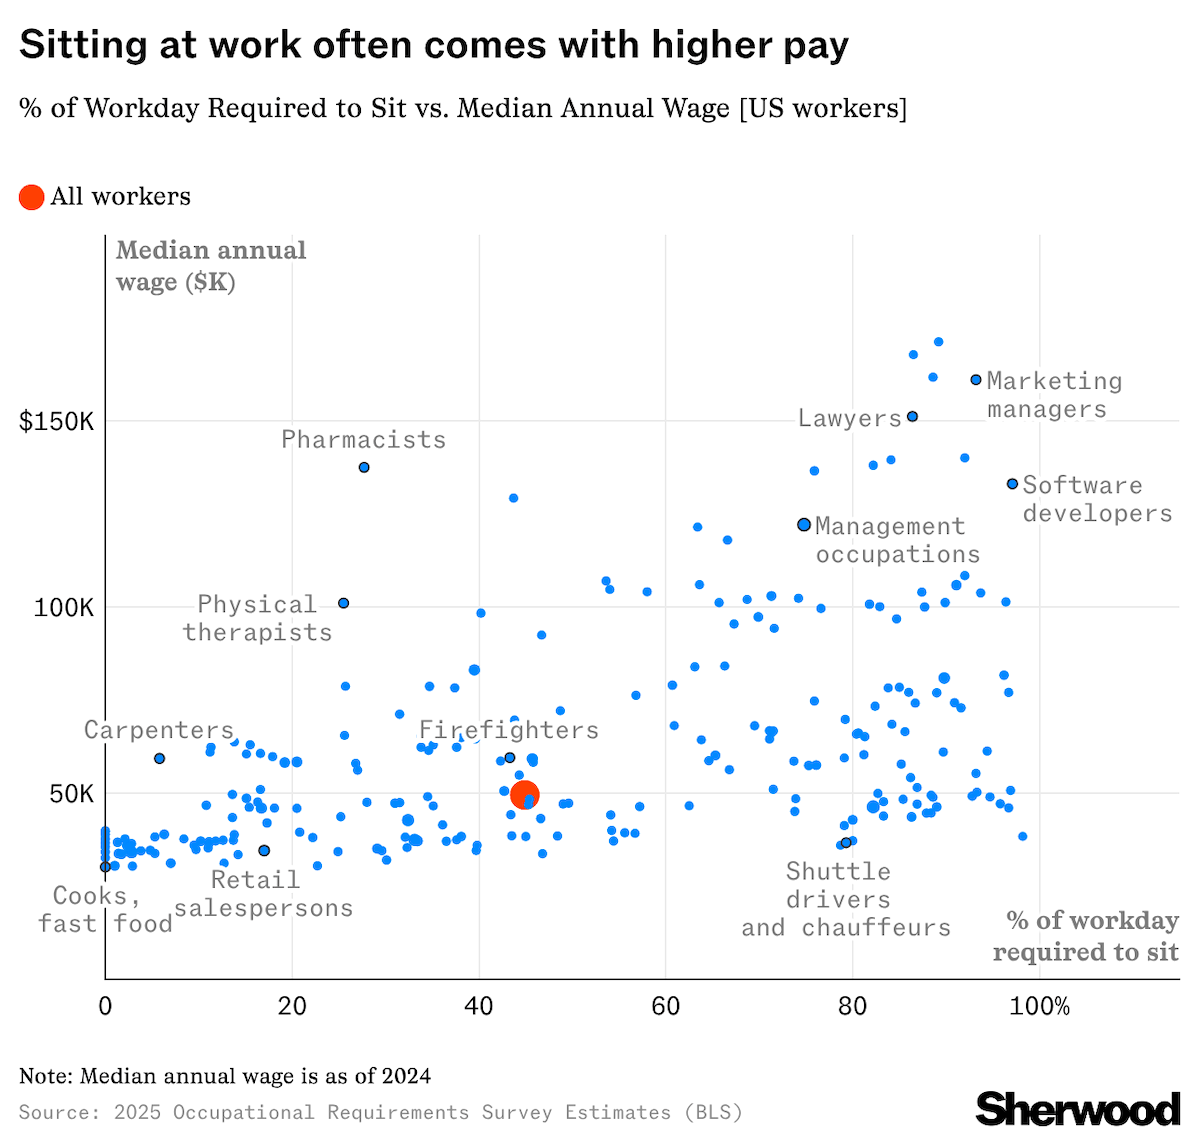
21) Sitting vs wages: This Sherwood chart suggests occupations requiring more desk time tend to have higher median pay, with clear occupation-level dispersion.
22) Econ dev utility links: For practical workflows, keep these in your toolkit: the searchable resource hub and the retail logo map builder. Use tools.econdevshow.com and retail logo maps.