17 Things Economic Developers Need to Know This Week
The stories Dane thinks you need to see. April 23, 2026 edition.

Welcome to this week's issue of What Economic Developers Need to Know This Week, where we collect links, charts, and ideas about the economy and place.
This week: 17 stories, graphics, and rabbit holes that are mostly relevant to economic development.
Today's email is brought to you by Resource Development Group
Resource Development Group and Convergent Nonprofit Solutions have recently announced a merger of these two well respected firms. RDG is now operating as Resource Development Group, a Convergent Company and will lead the combined operations in economic development and chamber engagements. Meanwhile, the Convergent banner will take the forefront on efforts on supporting traditional philanthropic and higher education organizations
This merger maintains RDG's innovative and custom approach while also creating the deepest bench of economic development and chamber fundraising expertise in the industry, the most complete data set in the country regarding economic development and chamber funding, and the greatest flexibility to be able to support engagement models tailored specifically to every market, regardless of size.
Whether you’re a single county EDO ready to kick off your first fundraising campaign or a large regional organization on your third funding cycle, they have the team and experience to get you the results you’re looking for.
1) Economic development and developers in the news #240: A fast scan of what 36 economic development executives and organizations in 21 states were sharing as of April 22, 2026. Read: Economic Development and Developers in the News #240.
2) 35 new economic development jobs this week: A practical market check on who is hiring, where they are hiring, and what they are paying, with roles across 15 states and salary ranges running from $31,000 to $256,000 as of April 17, 2026. Browse: 35 New Economic Development Jobs This Week.
3) Coming new week: Huge updates to Sitehunt. If you haven't seen it lately, book a demo.
4) Last week's 17 things issue: If you missed the April 16, 2026 edition, this is the clean catch-up link before you drop into the rest of this week's stack. Read: 17 Things Economic Developers Need to Know This Week.
5) AI is turning site selection into a visibility game: Area Development's core point is straightforward, AI tools are changing how companies discover places, and communities that do not publish clean, structured, current information risk disappearing from the early research phase. Economic developers should treat site, utility, workforce, and permitting data like a product now, because that information increasingly needs to work for both humans and machines.
6) Developing economic developers: Matt Forshee makes the case that the field needs a stronger talent pipeline of its own. That matters because many communities are asking small teams to handle incentives, real estate, political process, utility coordination, workforce, and marketing at the same time. If the profession does not invest in training and leadership development, local execution quality becomes another competitive gap.
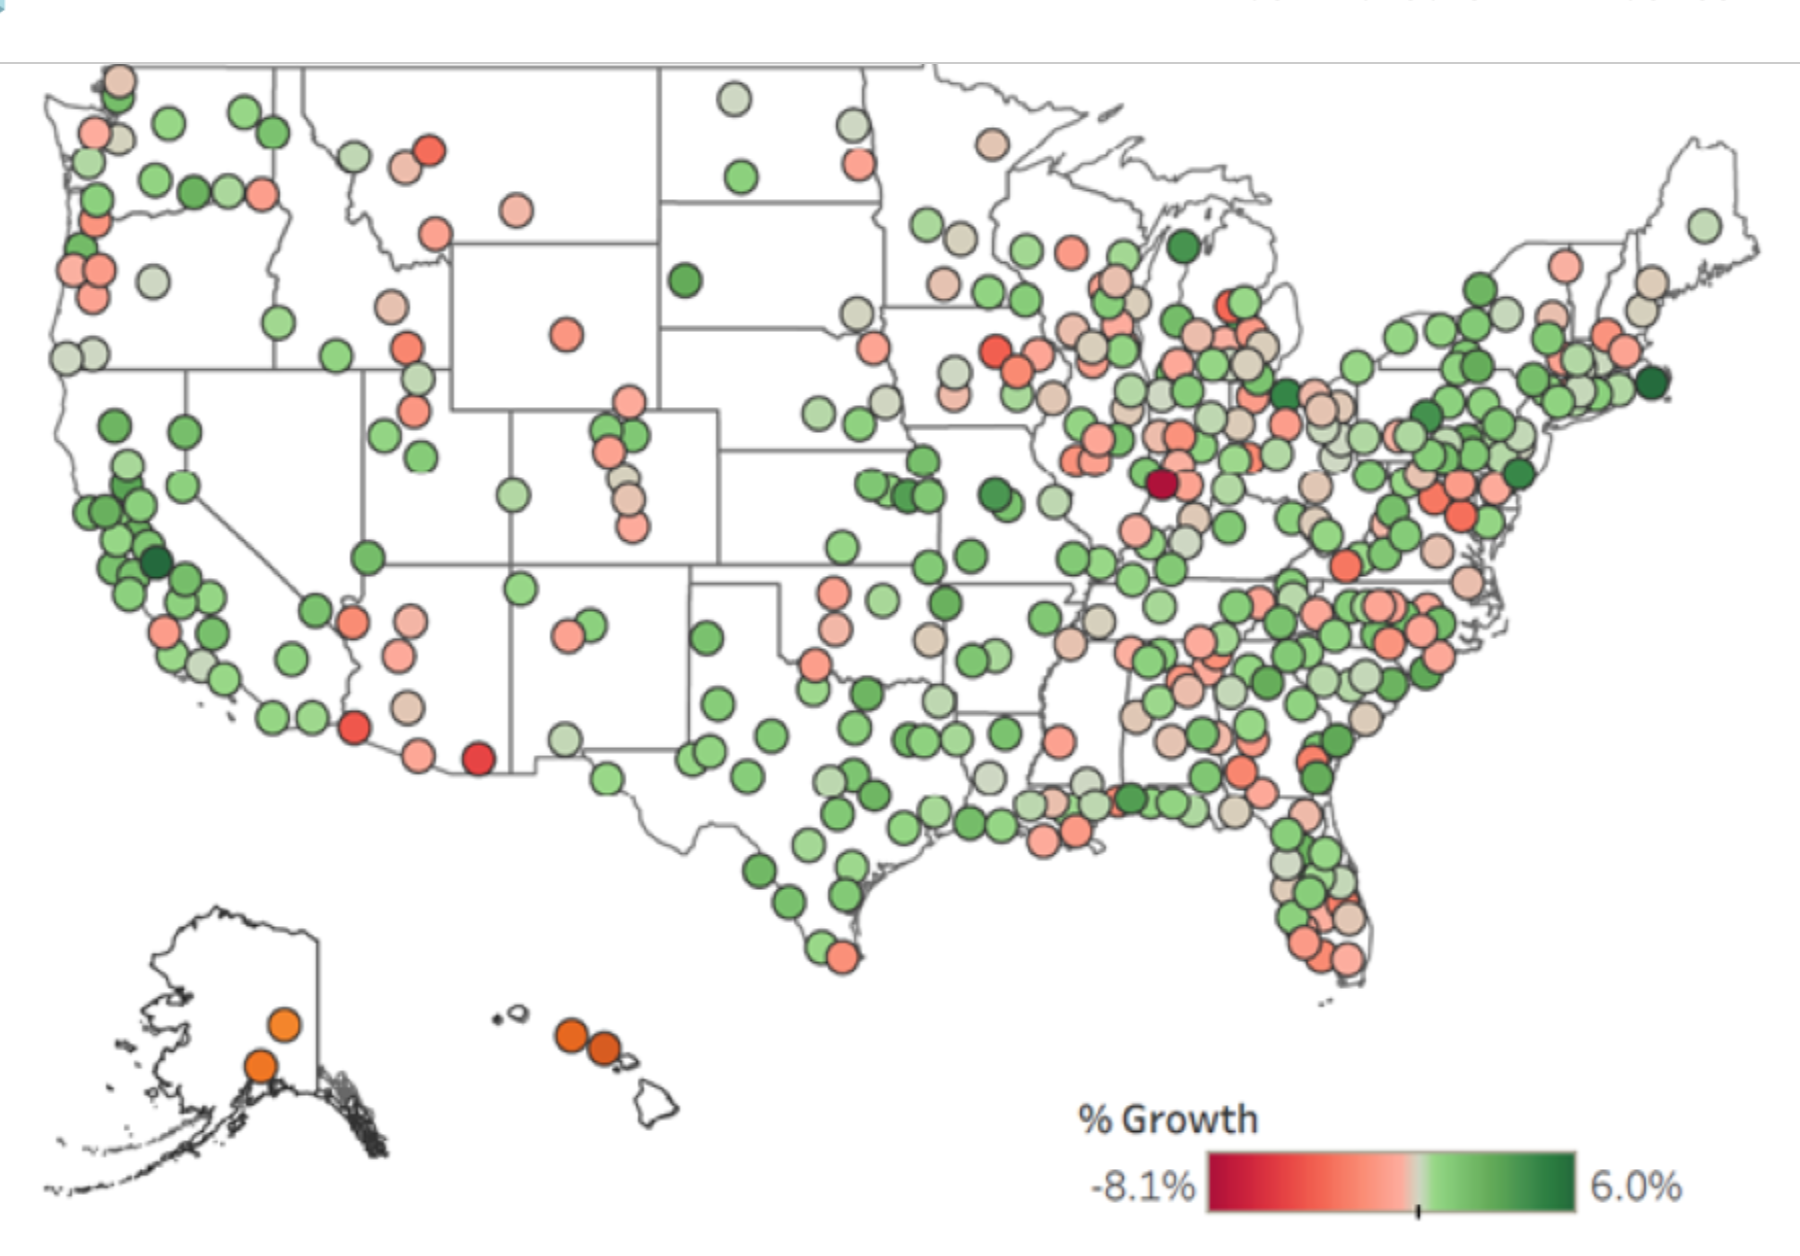
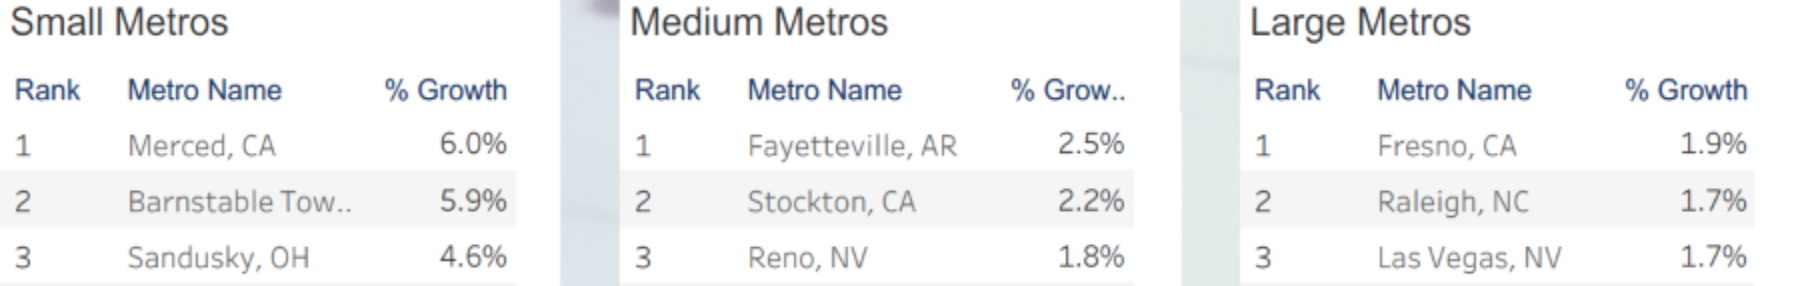
7) Job growth is still positive, but the map is getting patchier: Headlight's metro snapshot still shows growth across much of the country, but the pace is uneven and the slowdown is easier to see at the local level than in the national headline numbers. For economic developers, that means labor-market messaging should get more specific. General claims about a strong jobs economy are less persuasive than showing exactly how your metro compares with its peer set.
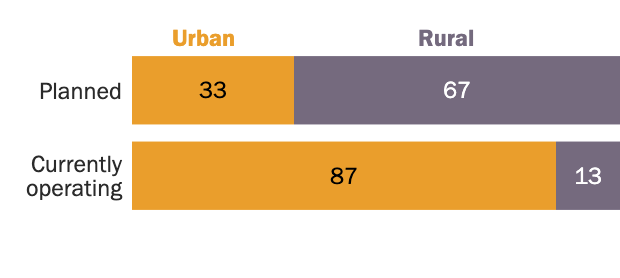
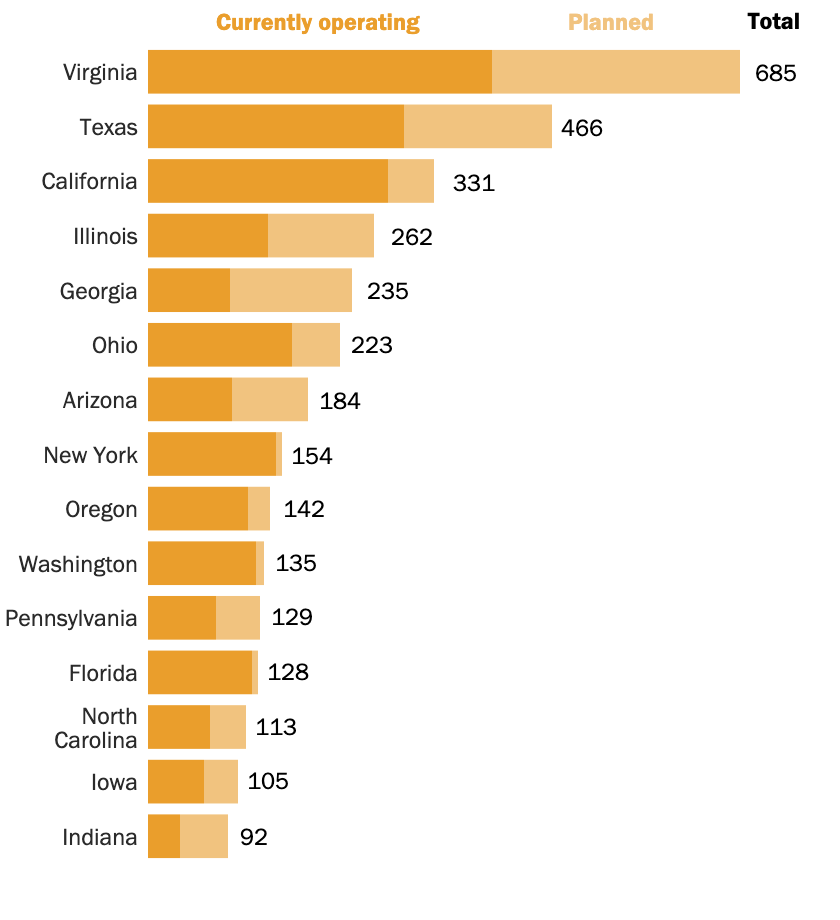
8) Most new data centers are not just a big-metro story: Pew's reporting is a useful corrective to the idea that data-center growth is only an urban or superstar-metro story. The geography is broader, and the implications go well beyond land sales. Rural places that win these projects still have to answer hard questions about power, water, tax structure, road capacity, and community tolerance for very large industrial facilities with limited direct employment.
9) Two gates now decide data-center site selection: Shannon Curley frames the new screening logic clearly, first when can a site actually be energized, and second will the community let it get built. In constrained markets, power timing alone can push projects five to ten years out, and zoning resistance is rising at the same time. That combination means data-center recruitment is no longer mostly a land-and-incentives exercise. It is now a power-delivery and entitlement strategy problem.
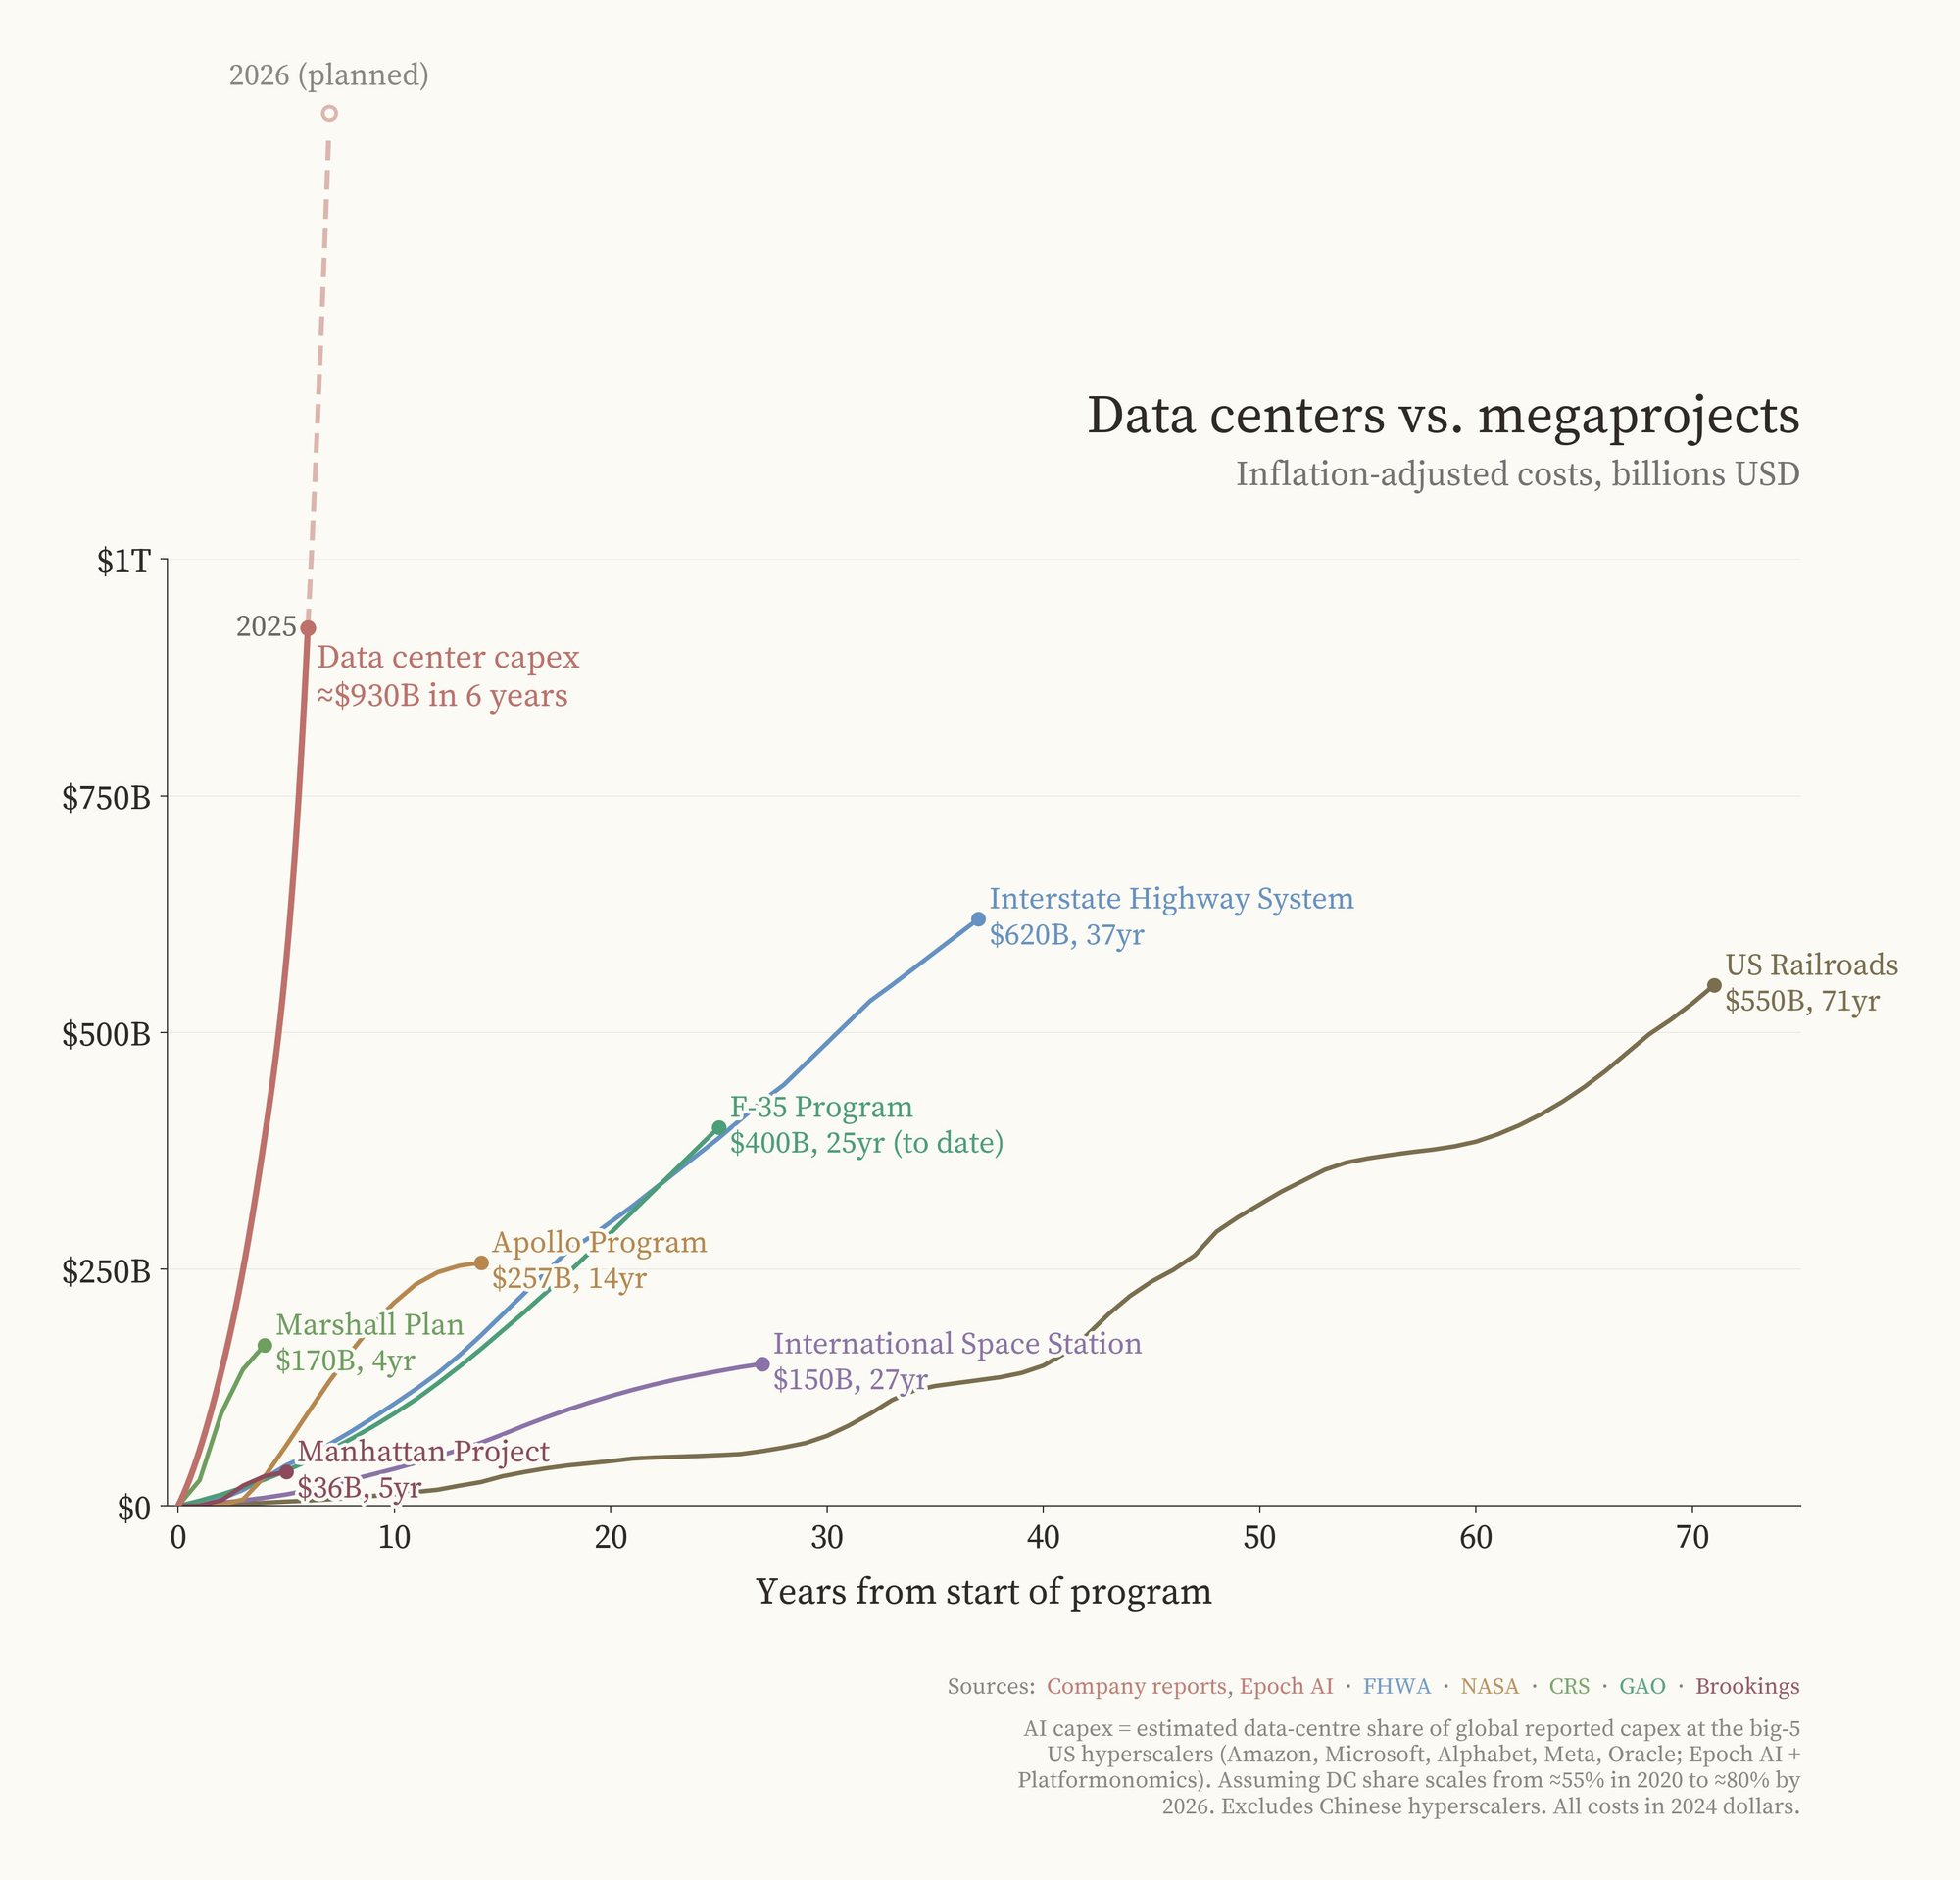
10) Data centers are starting to rival classic megaprojects as a development category: One useful way to read the current boom is that data centers are no longer a niche subset of industrial recruitment. They are becoming one of the defining project types shaping utility planning, community politics, and regional capacity decisions.
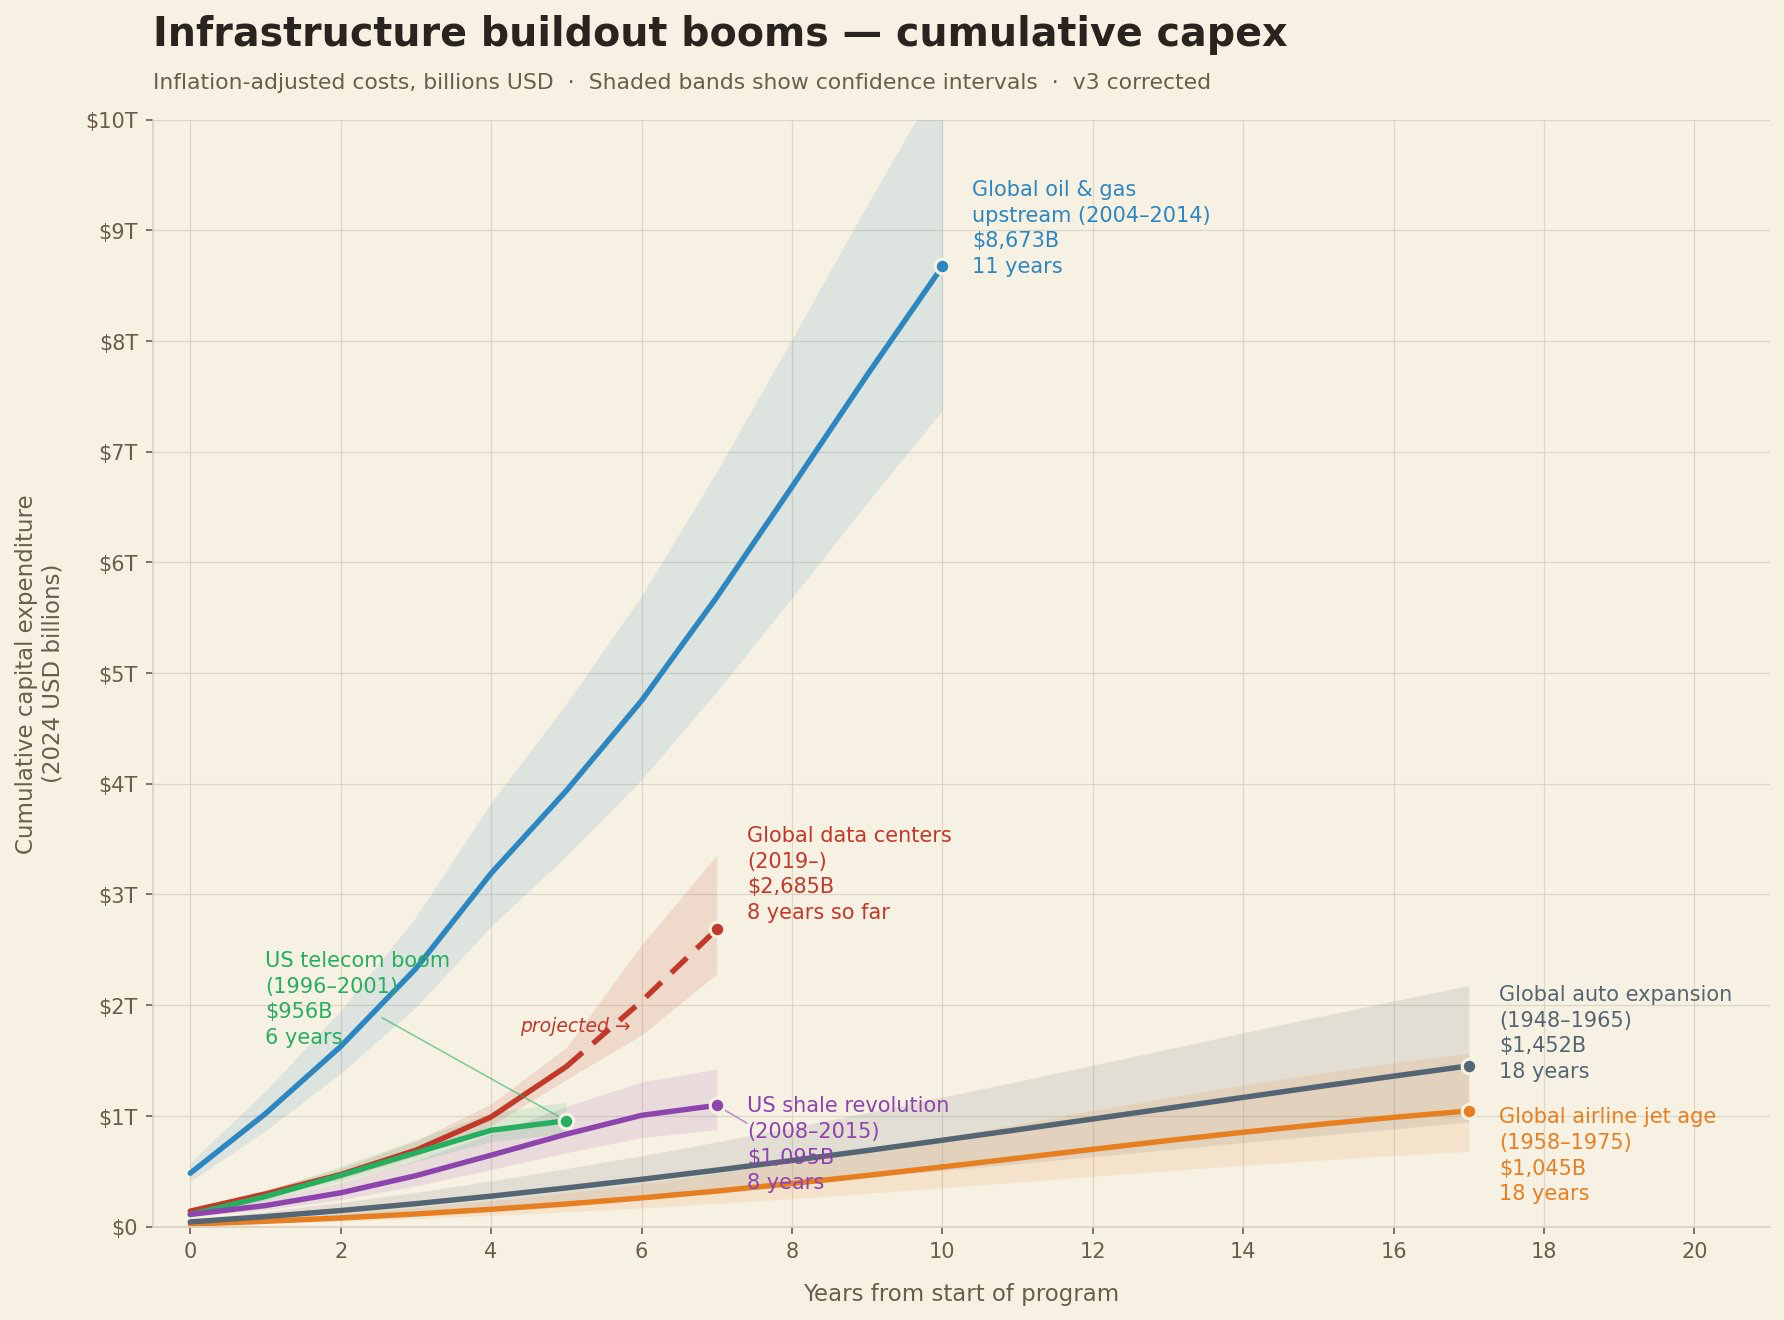
11) The infrastructure buildout is becoming a story of simultaneous systems stress: This chart works because it shows the problem economic developers increasingly face in practice, growth is no longer just about landing one project, it is about whether multiple systems can scale together. Power, transmission, substations, roads, water, and community process are all becoming binding constraints at once.
12) Houston's $10 billion I-45 rebuild shows how megaprojects become systems problems: Road Guy Rob's video on Texas's bigger Big Dig makes the key point in one line, the hardest engineering challenge is not moving car traffic, it is moving water traffic. That is a useful economic-development lens. Big urban projects live or die on drainage, sequencing, rights-of-way, freight movement, and the hidden infrastructure constraints sitting underneath the headline ribbon-cutting story.
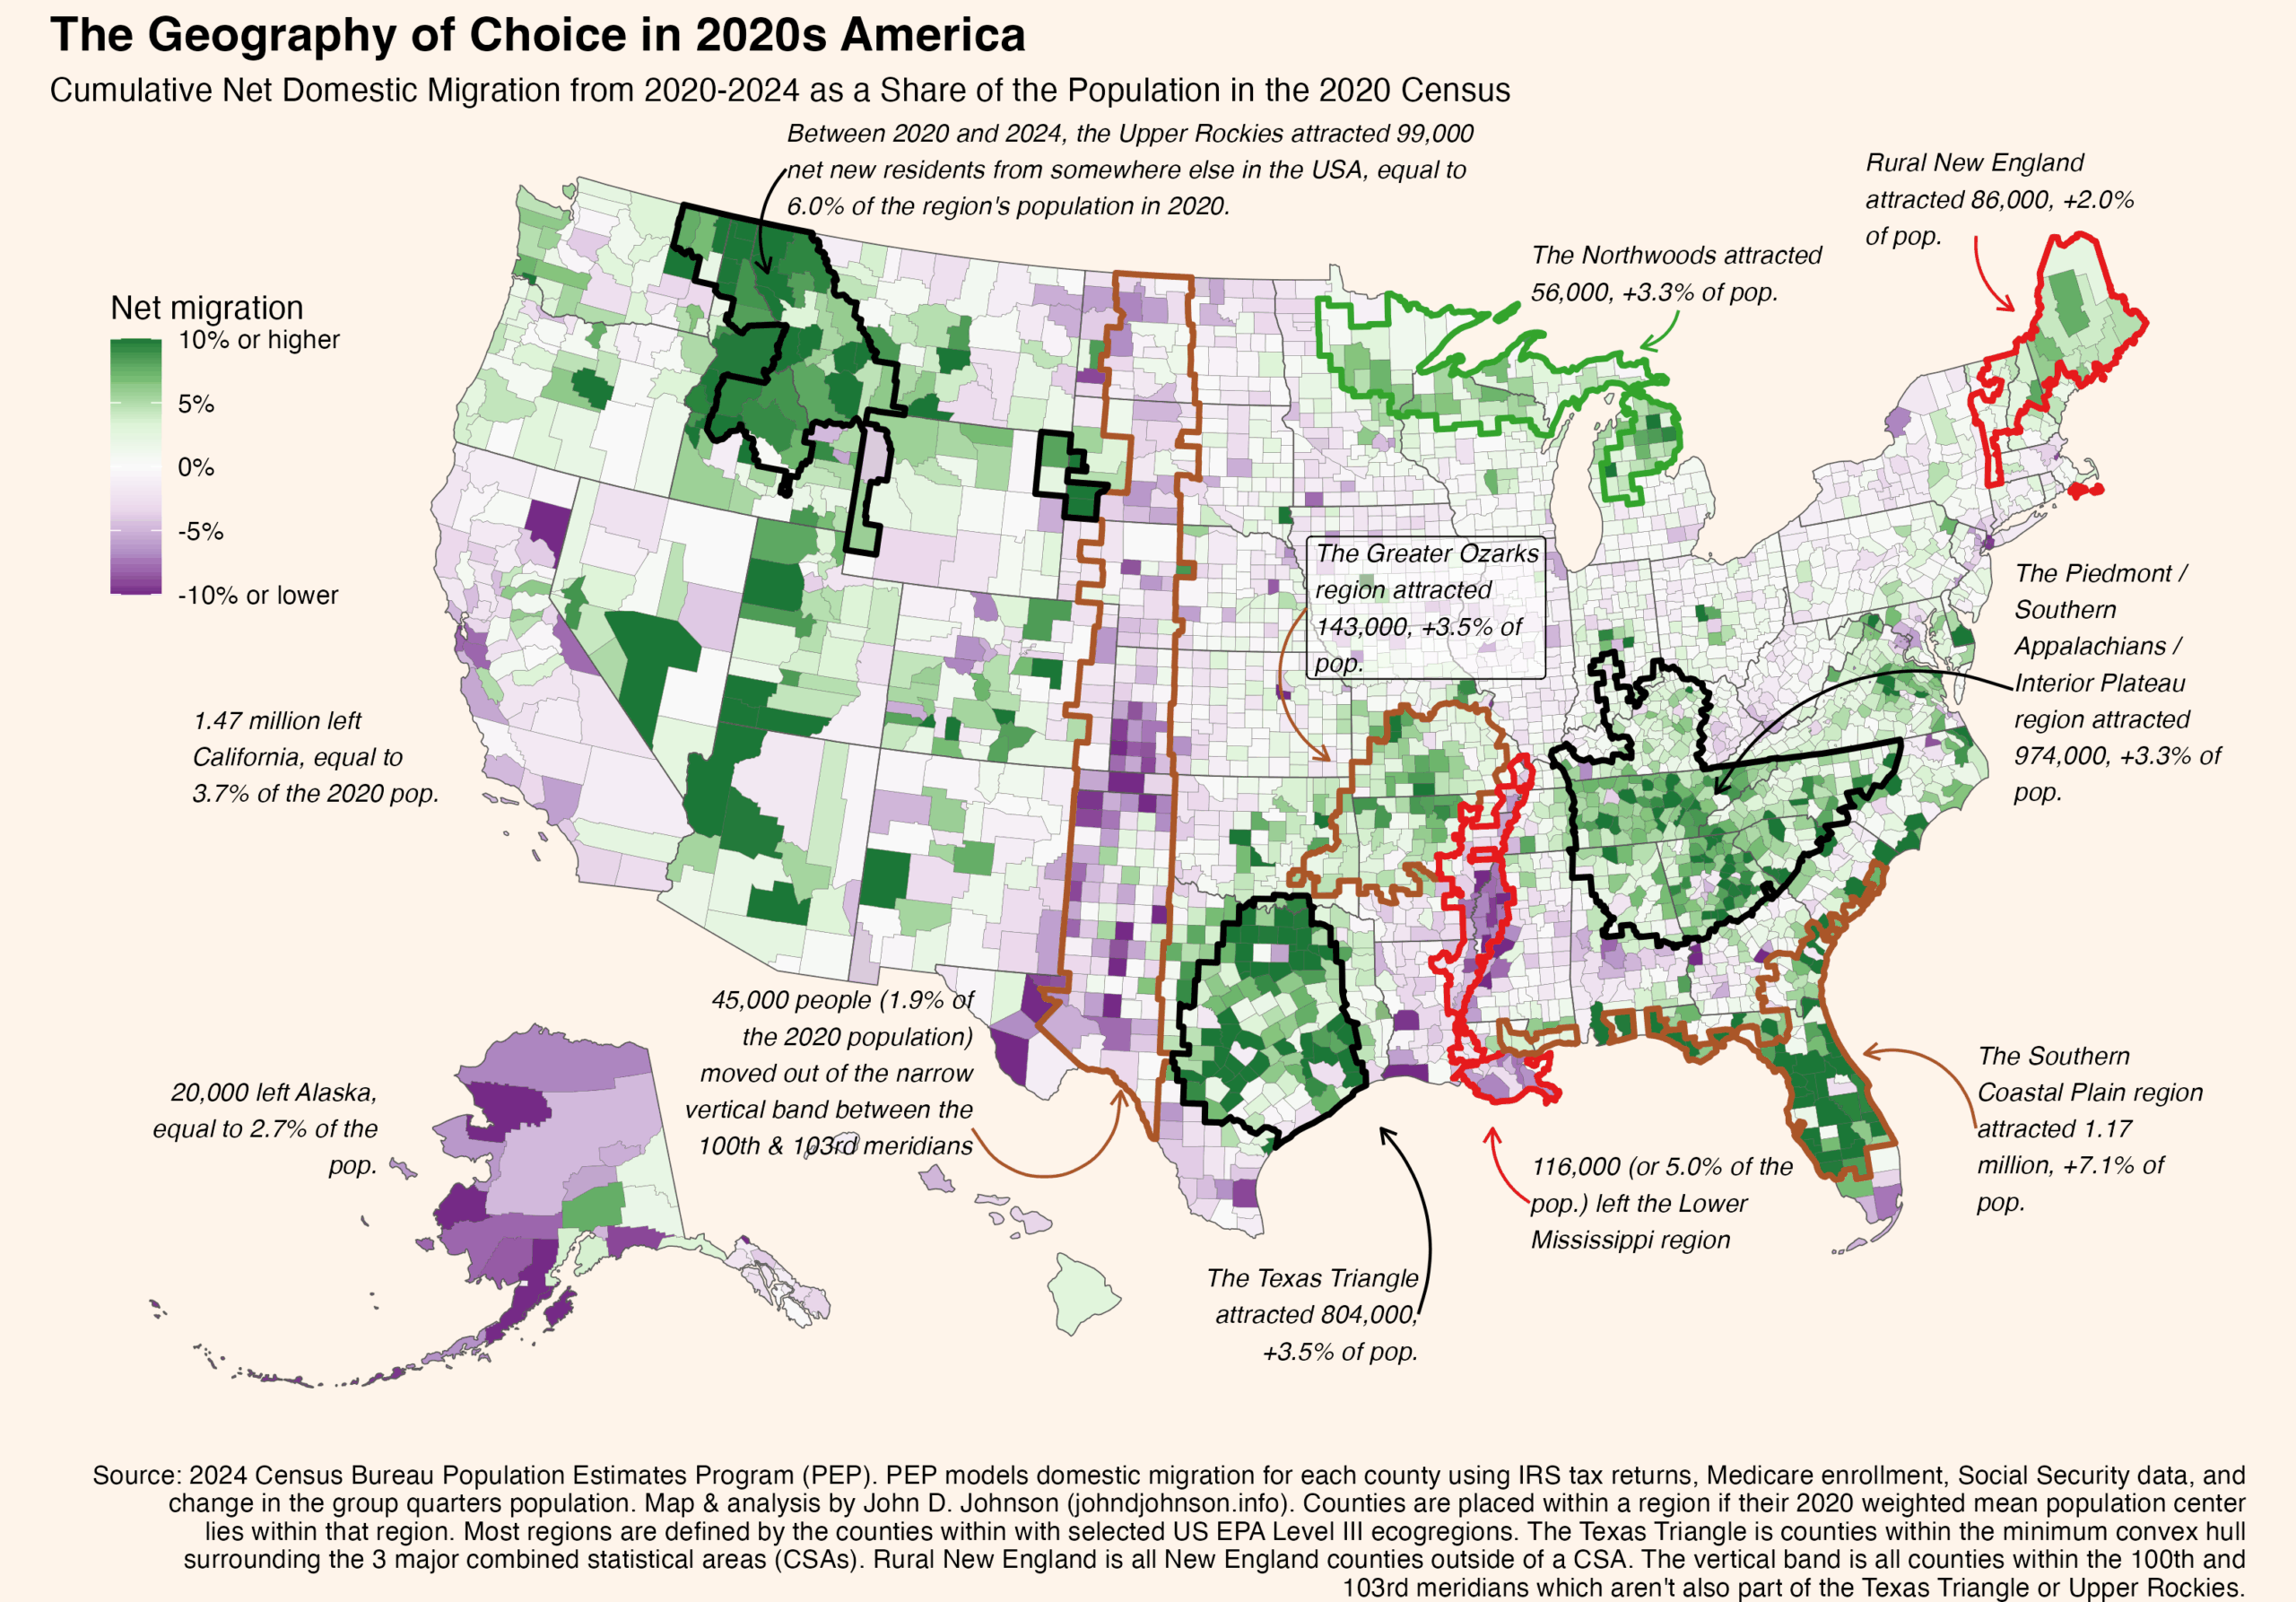
13) The geography of choice is becoming more visible in migration data: Marquette's map is a reminder that household movement is still a local story before it becomes a national one. Economic developers should read migration data as a product signal, where are people willing to trade up, trade down, or start over, and what combination of cost, schools, jobs, and lifestyle is driving that choice.
14) Urban apartment pipelines may now be more impaired than suburban ones: Jay Parsons argues that this is the first time in nearly two decades that urban apartments are being built more slowly than suburban apartments. His explanation is important, in many urban core markets, replacement cost is above value, so developers cannot make the math work. That could mean today's weak urban pipeline becomes tomorrow's urban rent pressure if demand returns before supply does.
15) Static tax-abatement schedules are a bad fit for capital-intensive projects: Jim Gibson's point is that many local incentive schedules still assume a simple, linear relationship between jobs and investment. That breaks down when automation, advanced manufacturing, and data-heavy facilities bring very large capital outlays with smaller direct headcounts. Communities that keep one rigid schedule may unintentionally price themselves out of viable projects, while sliding scales tied to both jobs and investment are a more realistic structure.
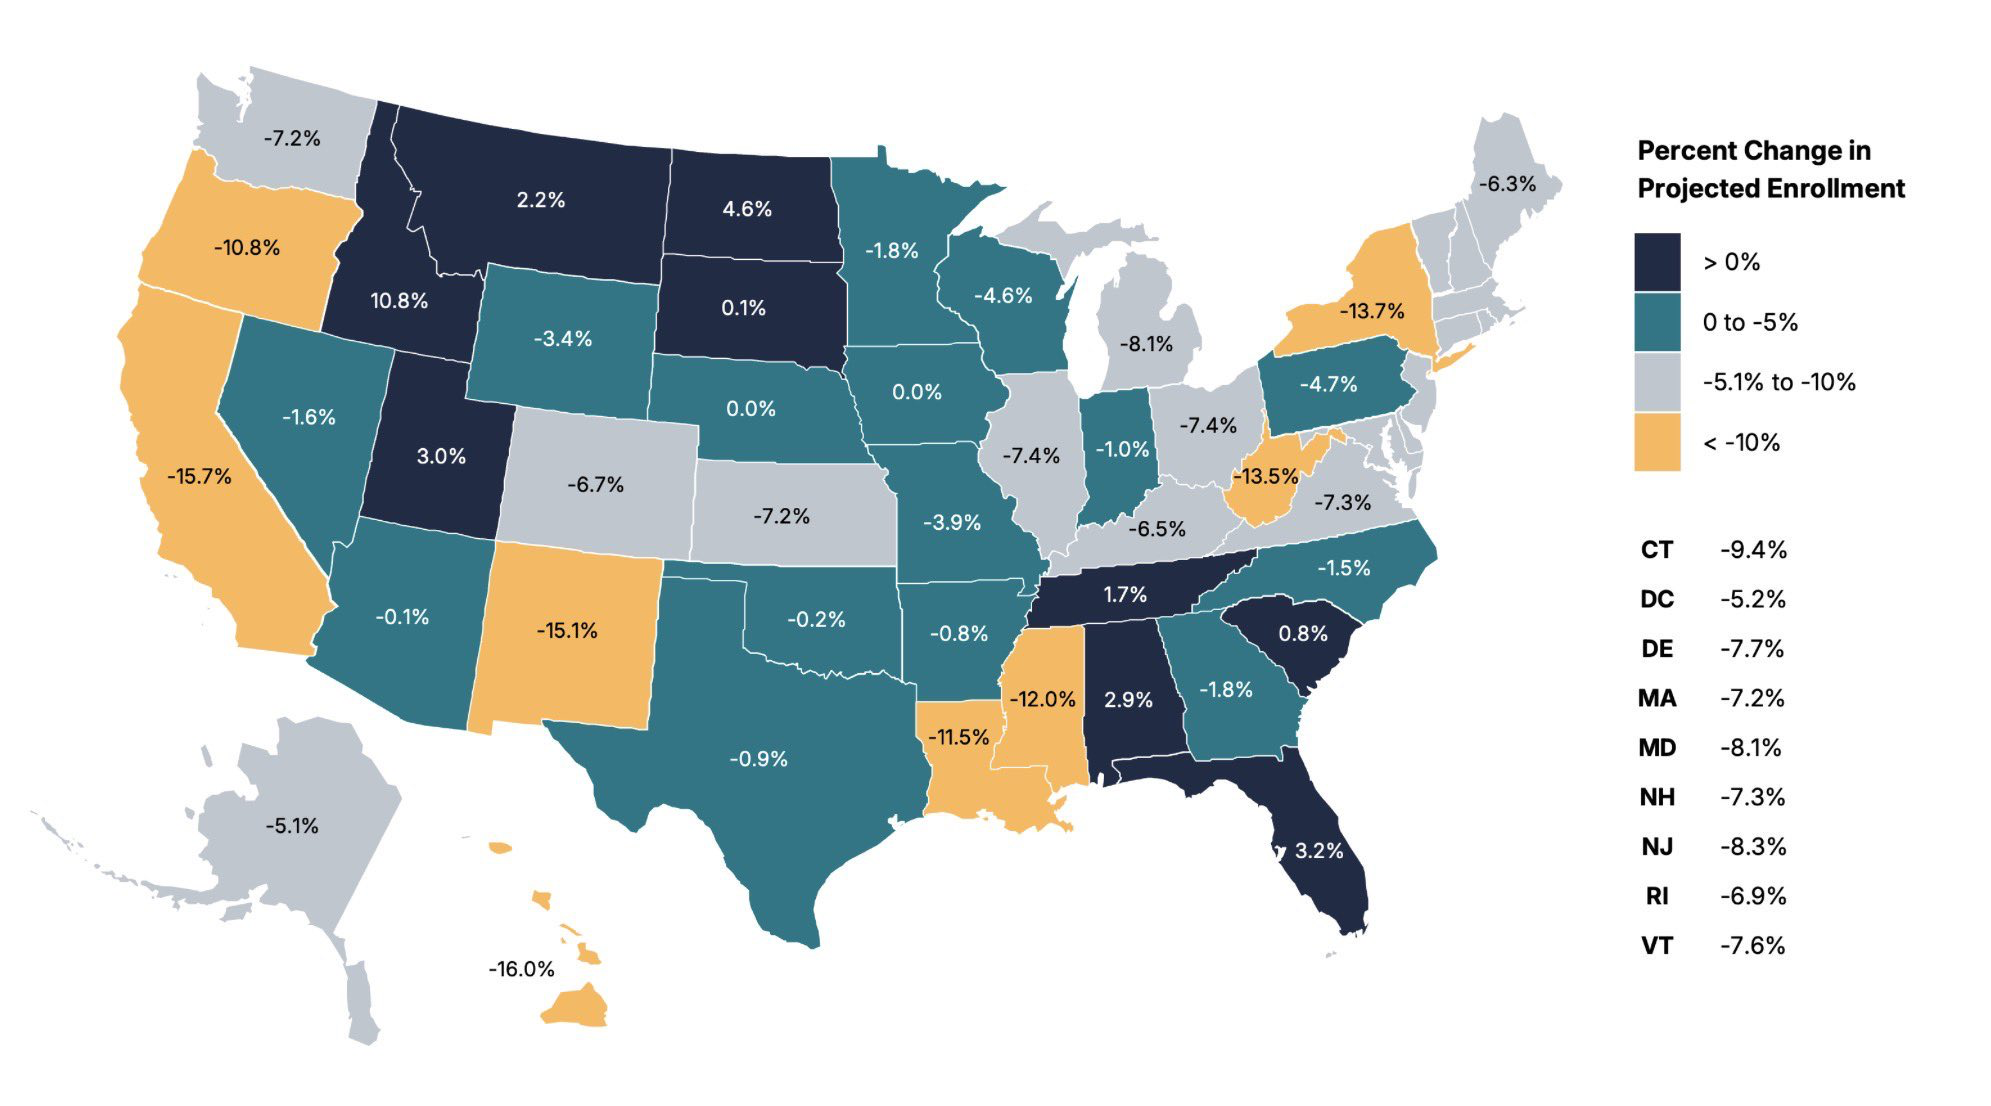
16) The enrollment cliff is still a map, not just a headline: This chart matters because talent pipelines are local and time-lagged. A shrinking student base affects future labor supply, institutional health, downtown demand, and in some places even the political case for public investment. Communities watching this trend should think beyond higher education and connect it to housing, retention, immigration, and employer strategy.
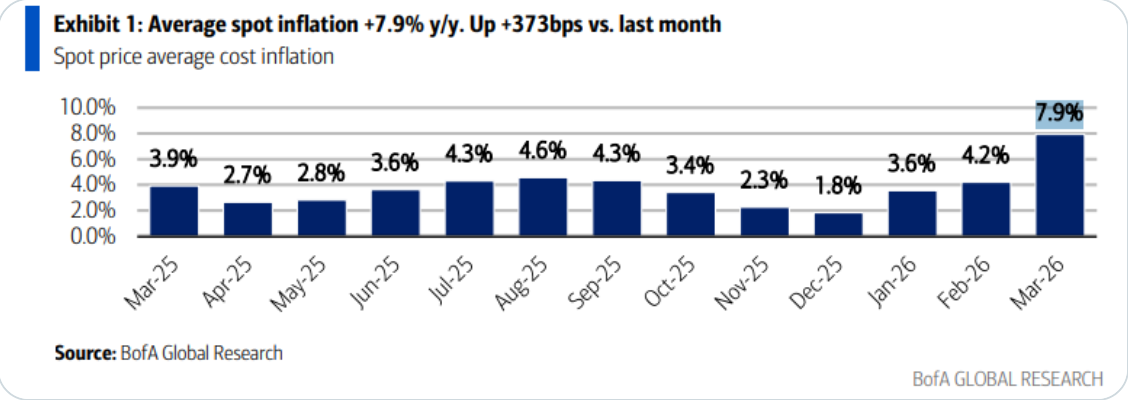
17) Food inflation is sending a very mixed signal again: Mike Zaccardi's chart is a useful reminder that inflation is no longer a single clean story consumers experience evenly. Some staple categories are spiking while others are collapsing. For economic developers, that matters less as a macro talking point than as a household-pressure indicator, because local sentiment, wage pressure, and retail behavior are shaped by the prices people notice every week.

Stop managing sites in a spreadsheet disguised as a map.
Most tools help you store property listings and make them look good online. Sitehunt actually understands your sites. It pulls together infrastructure, utilities, zoning, and regional context from millions of real data sources to build a complete picture automatically. No manual data entry. No guessing. No chasing down answers when a project comes in.
When the RFI hits, speed wins. Sitehunt doesn’t just display your sites, it evaluates them. You can match properties to project requirements, answer detailed questions instantly, and move from “we think this might work” to “here’s exactly why it works” in minutes. While others are still assembling information, you’re already submitting a complete, confident response.